


Application of microtremor survey and three-dimensional geological modeling in urban karst geological survey
-
摘要: 为解决城市地区地下岩溶地质结构勘探中传统物探方法噪声干扰大、测线布置受限以及二维勘探数据难以全面反映地质体三维空间结构等问题,提出了一种将微动勘探技术与地质统计学相结合的三维地质建模方法。文章以济南城市轨道交通拟建4号线泉城公园站—千佛山站区间为例,在城市岩溶地区,首先开展了二维微动勘探,实现了二维测线剖面的物性参数反演。在此基础上,结合三维地质统计学建模方法,通过变差函数分析,获得了地质物性参数的空间相关性,并建立了研究区三维速度模型。结合钻孔资料分析,二维勘探成果与钻孔结果的吻合度较高。与二维剖面人工解释对比发现,地质统计学三维速度模型提取的区域并不能完全对应单个溶洞,而是溶洞高发区域,这表明地质统计学建模方法具有平滑效应,不能精确刻画单个溶洞的分布特征。然而溶洞高发区域的直观展示,能够为工程施工提供必要的指导。该方法可有效提升地下岩溶地质结构勘探的精度与全面性,提高勘探效率、降低勘探成本,为地下岩溶地质结构的精确勘探提供了新途径。Abstract:
The exploration of underground karst geological structures in urban environments poses significant challenges for conventional geophysical methods. These methods often suffer from high levels of noise, constraints on survey line layouts due to dense infrastructure, and the inherent limitation of two-dimensional (2D) data in representing the three-dimensional (3D) spatial complexity of geological bodies. To address these issues, this study proposes and demonstrates an integrated methodological framework that combines microtremor survey technology with 3D geo-statistical modeling to enhance subsurface characterization in karst terrains. The research was conducted within the planned section between Quancheng Park Station and Qianfo Mountain Station on Line 4 of the Jinan Urban Rail Transit System, a typical urban area underlain by karst-prone strata. Initially, a two-dimensional microtremor survey was implemented. Employing a linear array configuration with two-meter receiver spacing using three-component geophones, data were collected along 18 survey lines totaling 2,242 meters in length, encompassing 1,139 physical points. This passive-source method effectively utilizes ambient seismic noise generated by urban activities (e.g., traffic) and natural phenomena as the signal source, thereby overcoming the noise sensitivity of active-source methods and simplifying field logistics. Data processing involved preprocessing the recorded signals, extracting Rayleigh wave dispersion curves using the Spatial Auto-Correlation (SPAC) method, and subsequently inverting these curves to derive 2D shear-wave velocity (Vs) profiles. These profiles visually delineate subsurface velocity structures, where low-velocity anomalies against higher-velocity bedrock backgrounds indicate potential karst features such as cavities, dissolution zones, or fractured rocks. The inversion results from representative lines (e.g., QQWT01 and QQWT09) reveal a vertically layered velocity structure: very low velocities (500 m·s−1) in the shallow Quaternary overburden; intermediate velocities (500–1 500 m·s−1) corresponding to moderately weathered and karstified dolomite; and higher velocities (1 500 m·s−1) representing more competent, less weathered bedrock. Laterally, several distinct low-velocity zones were identified and interpreted as areas of karst development. Importantly, the interpretations from these 2D profiles showed a high degree of consistency with borehole data (e.g., boreholes W2, W3, W4), which encountered cavities and filled materials at depths predicted by the velocity anomalies, thereby validating the reliability of the microtremor method for karst detection in this setting. However, 2D profiles provide information only along specific lines, leaving gaps in understanding the full 3D spatial distribution of karst features. To address this limitation, the study employed 3D geostatistical modeling techniques. The densely sampled Vs data points from all 2D profiles were treated as a regionalized variable. Variogram analysis was conducted to quantify the spatial correlation structure of shear-wave velocity in three principal directions: along the dominant survey direction (approximate E–W), perpendicular to it (N–S), and vertically. An exponential variogram model was fitted, revealing spatial correlation ranges (e.g., 120 m maximum, 15 m minimum) that characterize the continuity and variability of the geological units. Using ordinary kriging as the estimation method, a continuous 3D Vs model of the entire study volume was constructed based on the 2D profile data and the derived variogram parameters. This 3D model was then visualized using volume rendering techniques. By setting transparency thresholds for different velocity ranges, the model enables intuitive 3D visualization of karst-prone zones. For instance, rendering zones with Vs < 1,500 m·s−1 as opaque highlights volumes with potential karst development. Further refinement, such as extracting volumes with Vs < 1,200 m·s−1, helps identify areas with a high incidence of cavities. Comparative analysis between the 3D model extracts and detailed 2D profile interpretations indicates that the geo-statistically derived model does not precisely delineate individual, isolated cavities. This limitation is attributed to the smoothing effect inherent in kriging interpolation, which tends to amalgamate closely spaced anomalies. Instead, the model effectively outlines the broader "karst high-incidence zones" or "karst development regions", where the probability of encountering karst features is significantly elevated. Despite this smoothing limitation, the primary value of the integrated approach lies in its comprehensive 3D perspective. It synthesizes scattered 2D line data into a coherent volumetric model, providing a more holistic view of subsurface karst hazard distribution than is possible with 2D sections alone. The clearly visualized 3D zones of elevated karst risk offer invaluable, spatially explicit guidance for engineering planning, risk assessment, and targeted mitigation strategies in urban rail transit and other underground projects. This methodology enhances exploration efficiency by maximizing information extraction from passive seismic data, reduces costs associated with excessively dense drilling, and provides a novel, more comprehensive pathway for precise imaging of urban underground karst systems-ultimately contributing to safer construction and long-term infrastructure maintenance. -
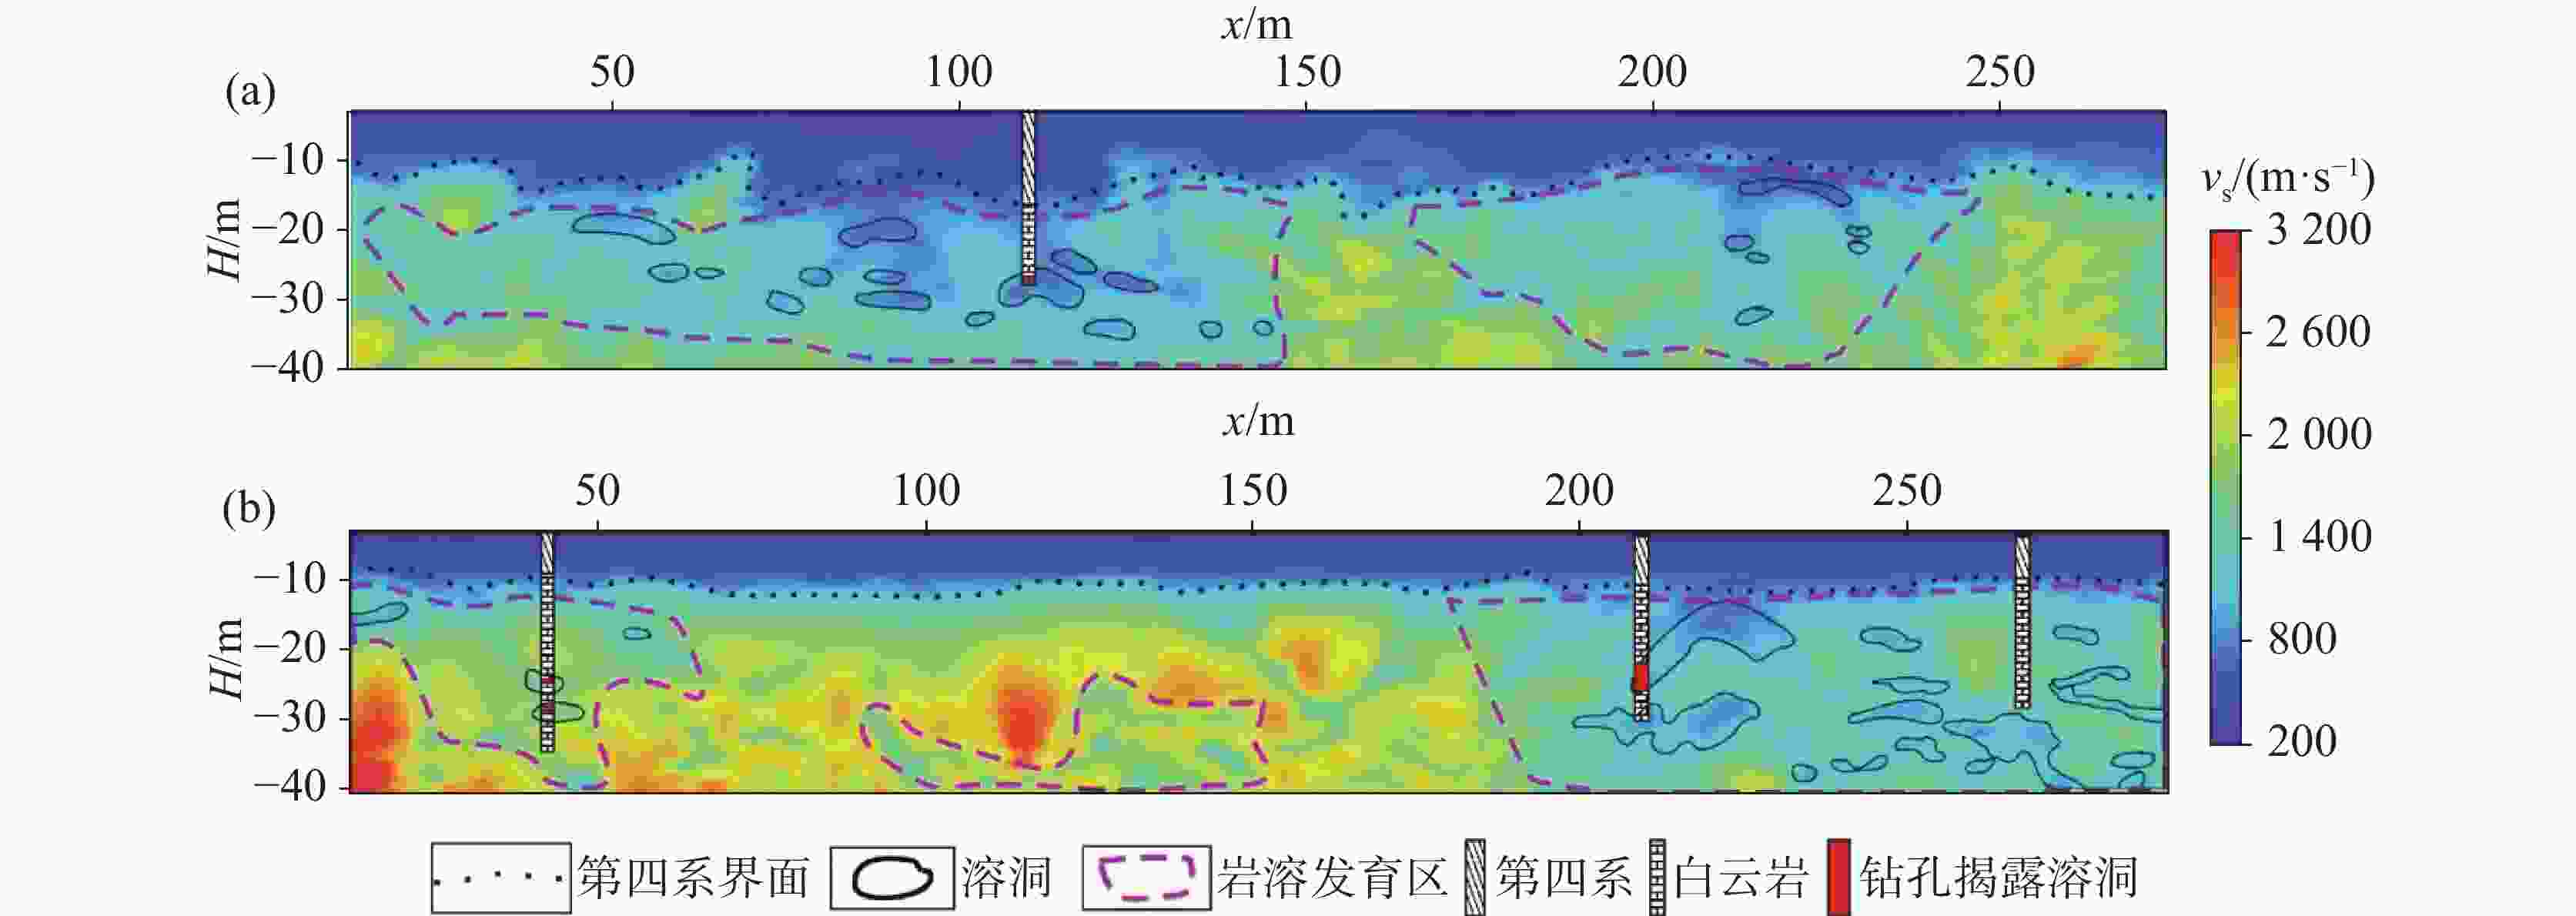
图 2 面波视速度剖面图和地质解释(a. QQWT01测线, b. QQWT09测线)
Figure 2. Profile of surface wave apparent velocity and geological interpretation (a. QQWT01 survey lines, b. QQWT09 survey lines)
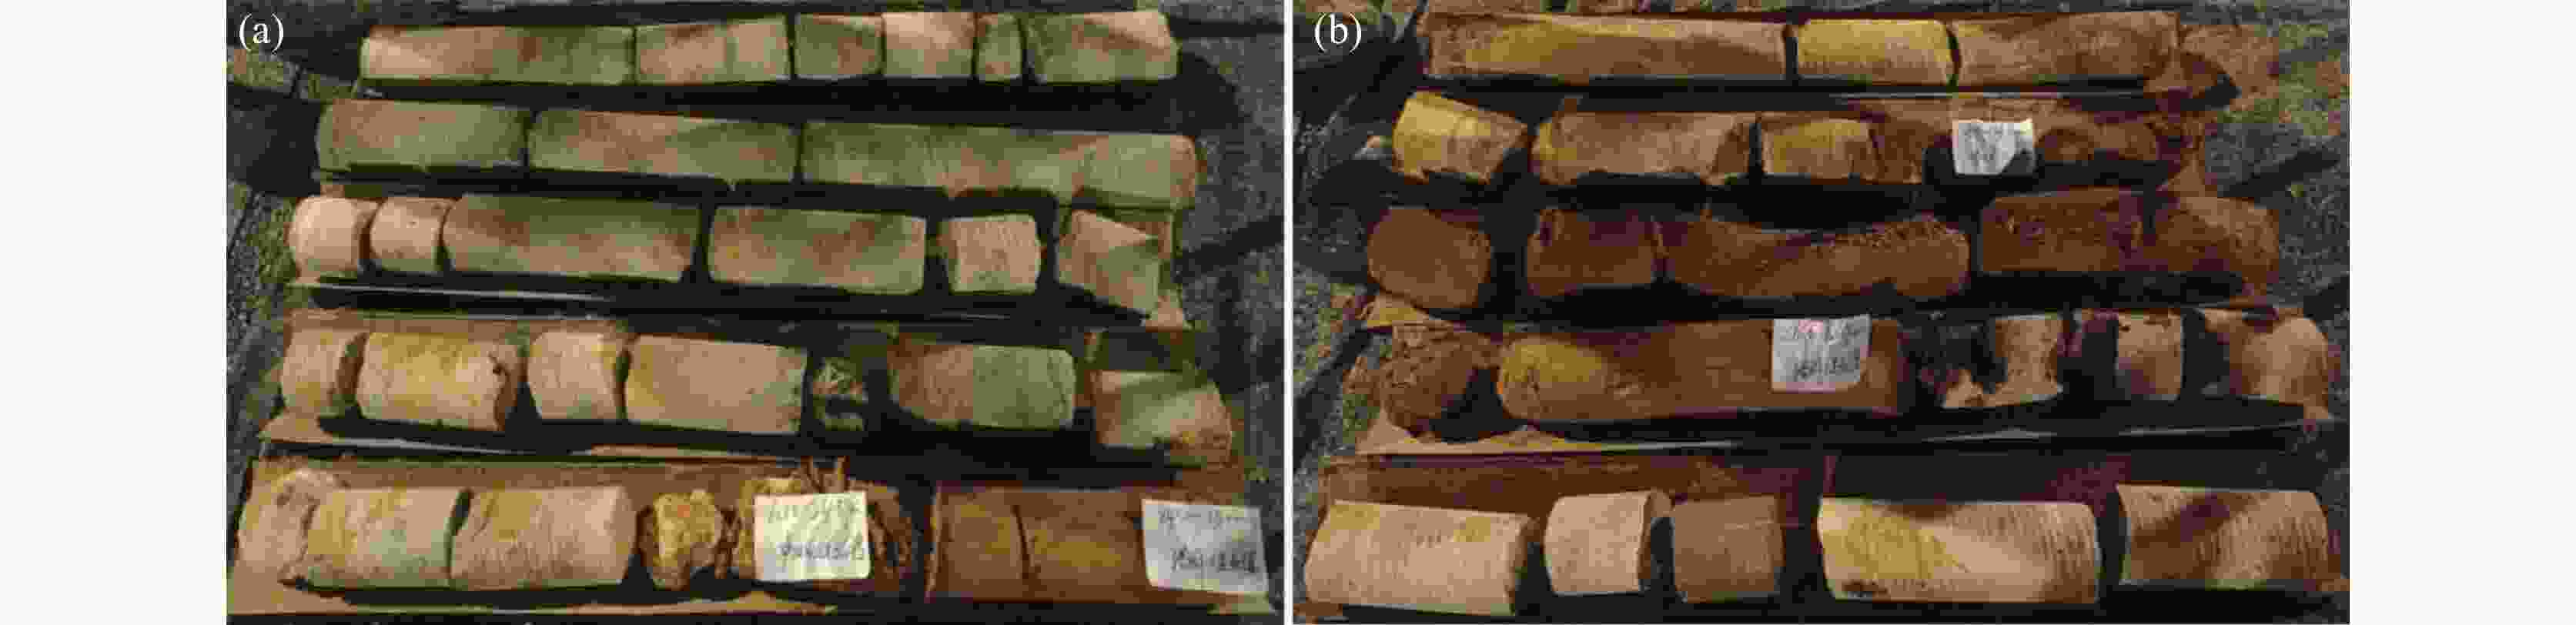
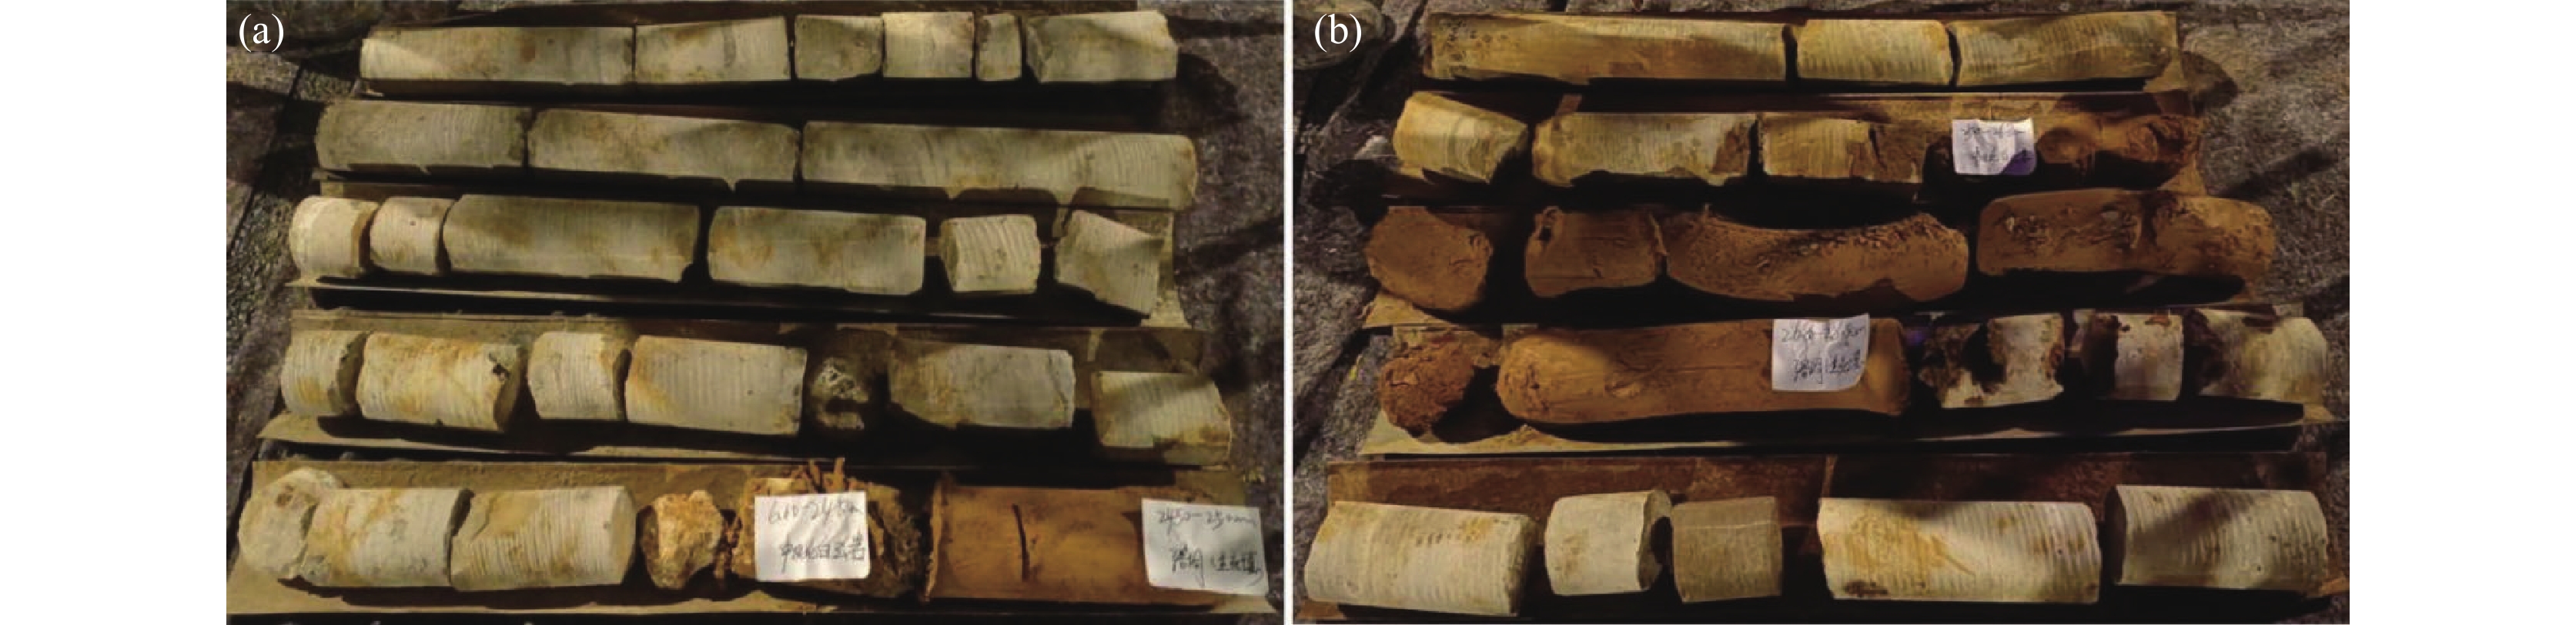
图 3 w3钻孔岩心照片(a. 20~25 m岩心, b. 25~30 m岩心)
Figure 3. Photos of the core from Borehole w3 (a. Core from 20 to 25 m, b. Core from 25 to 30 m)
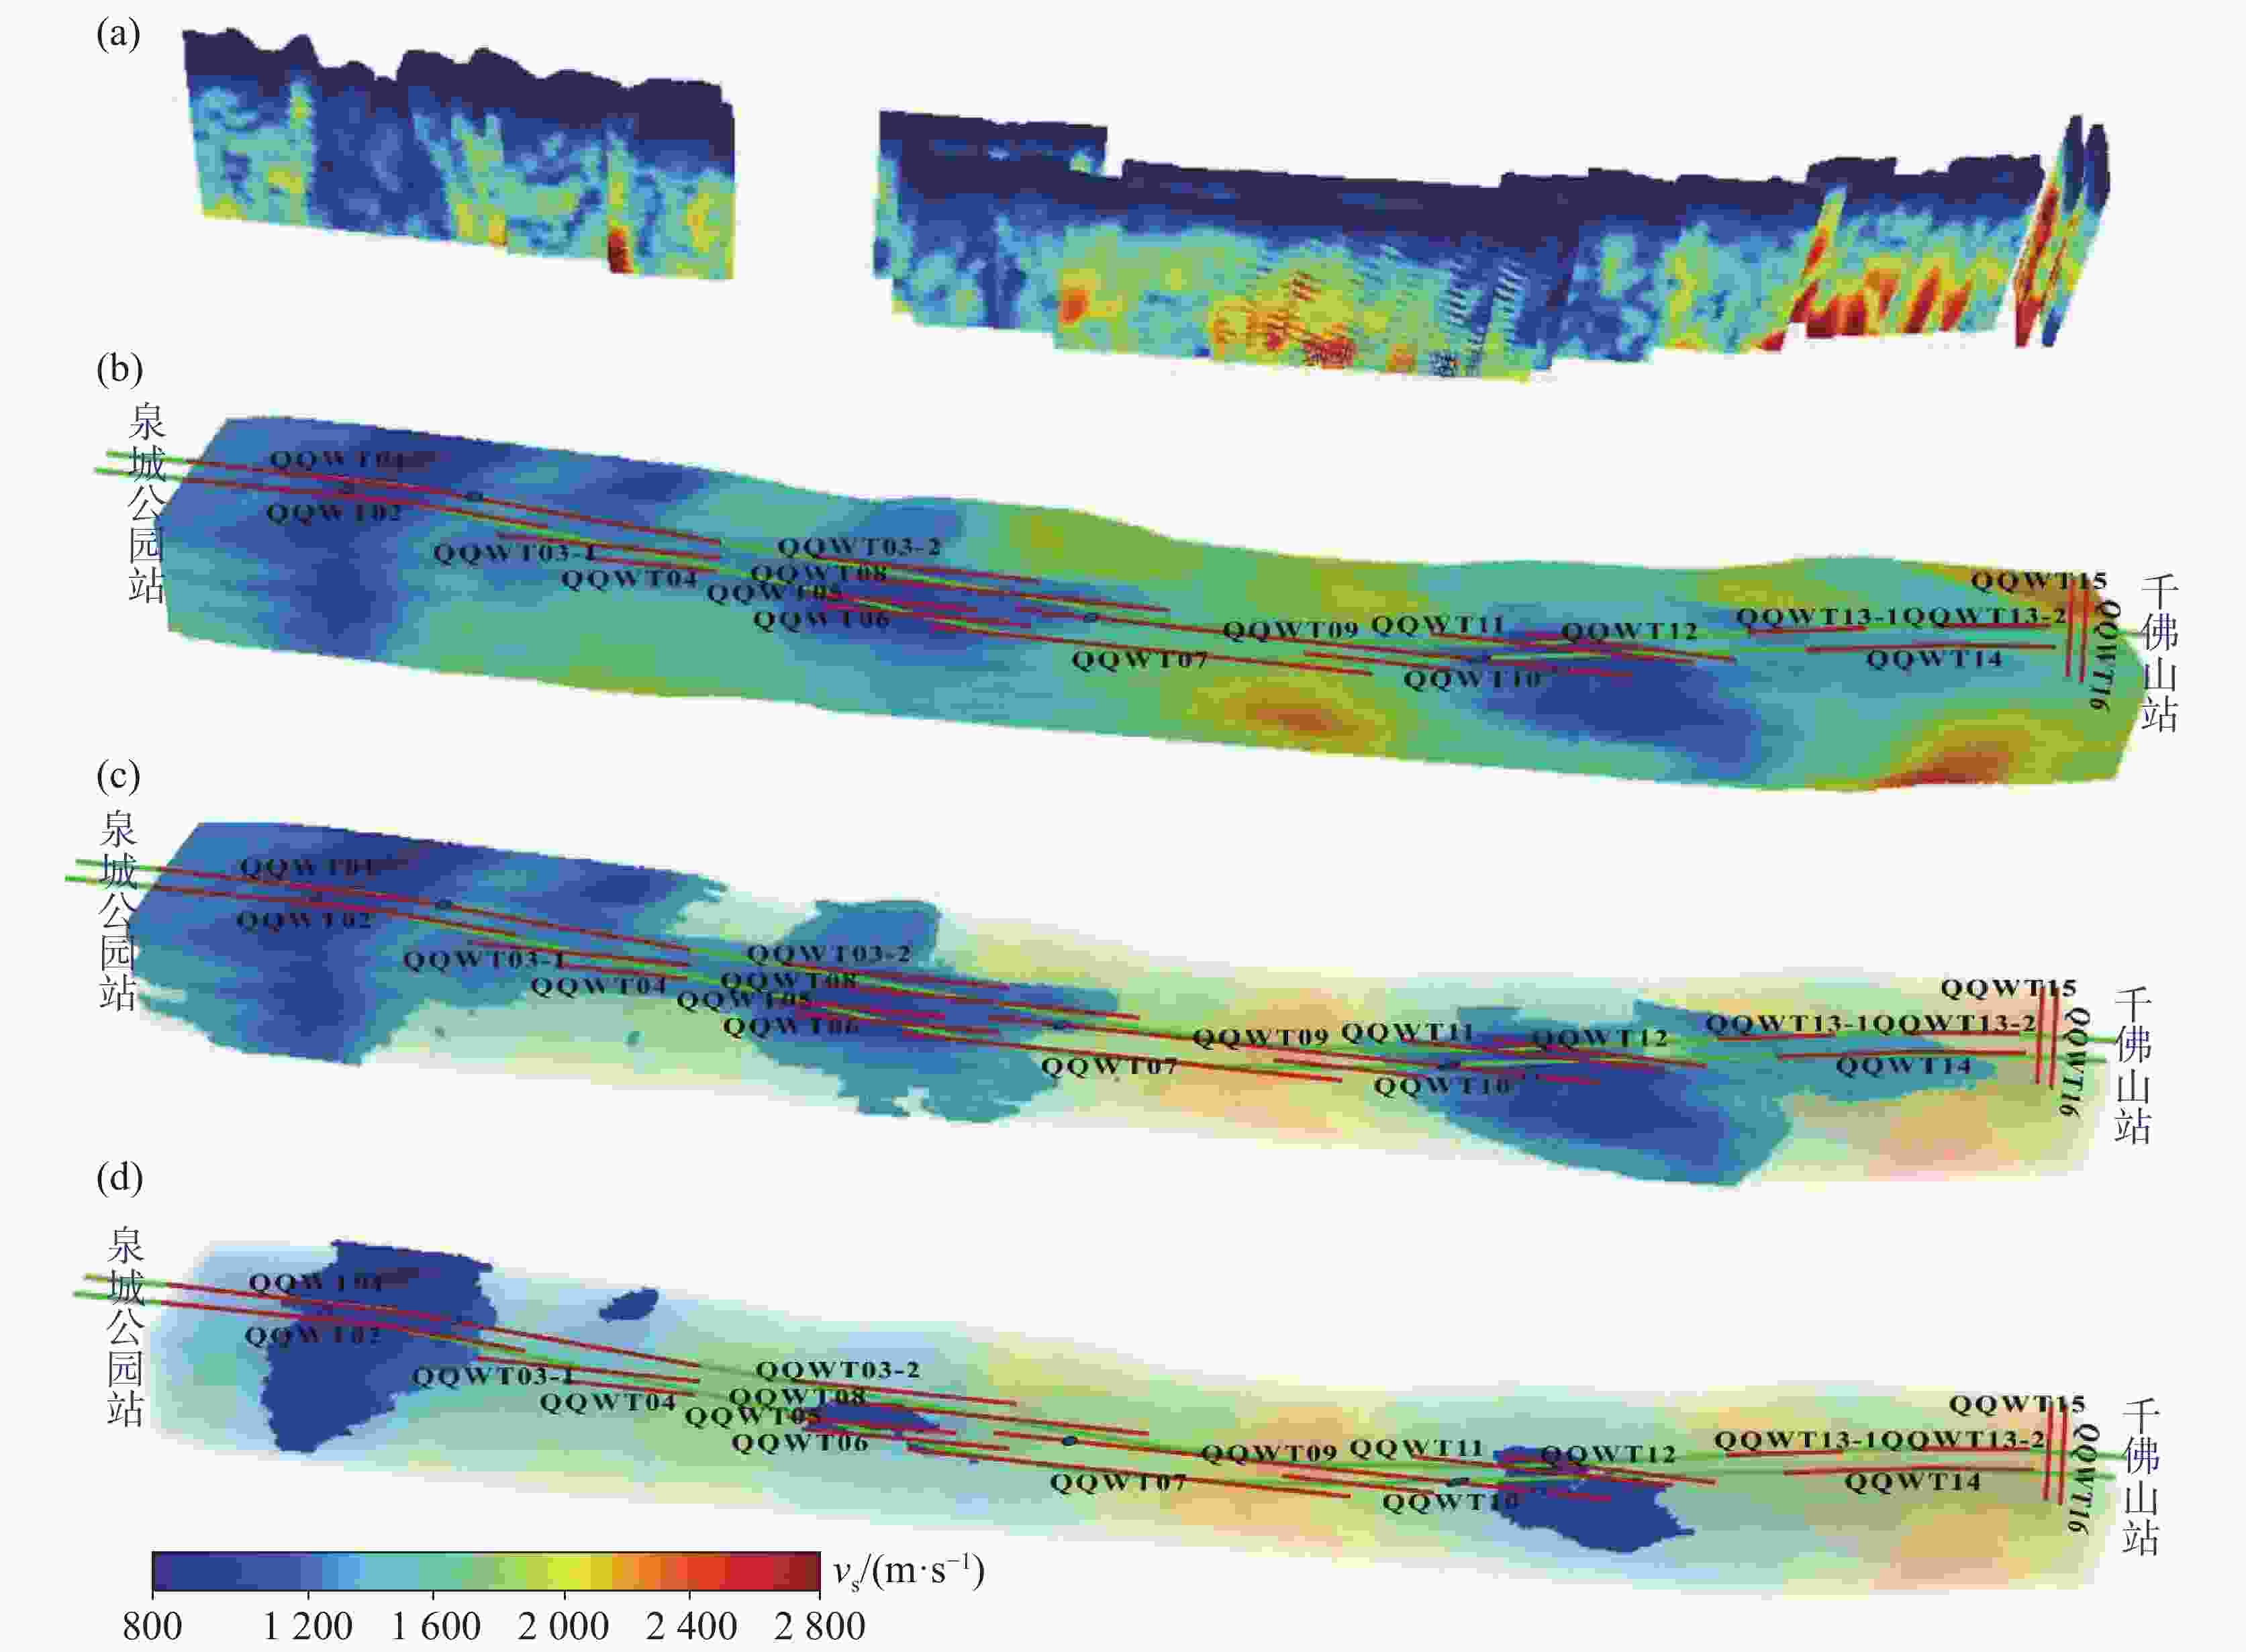
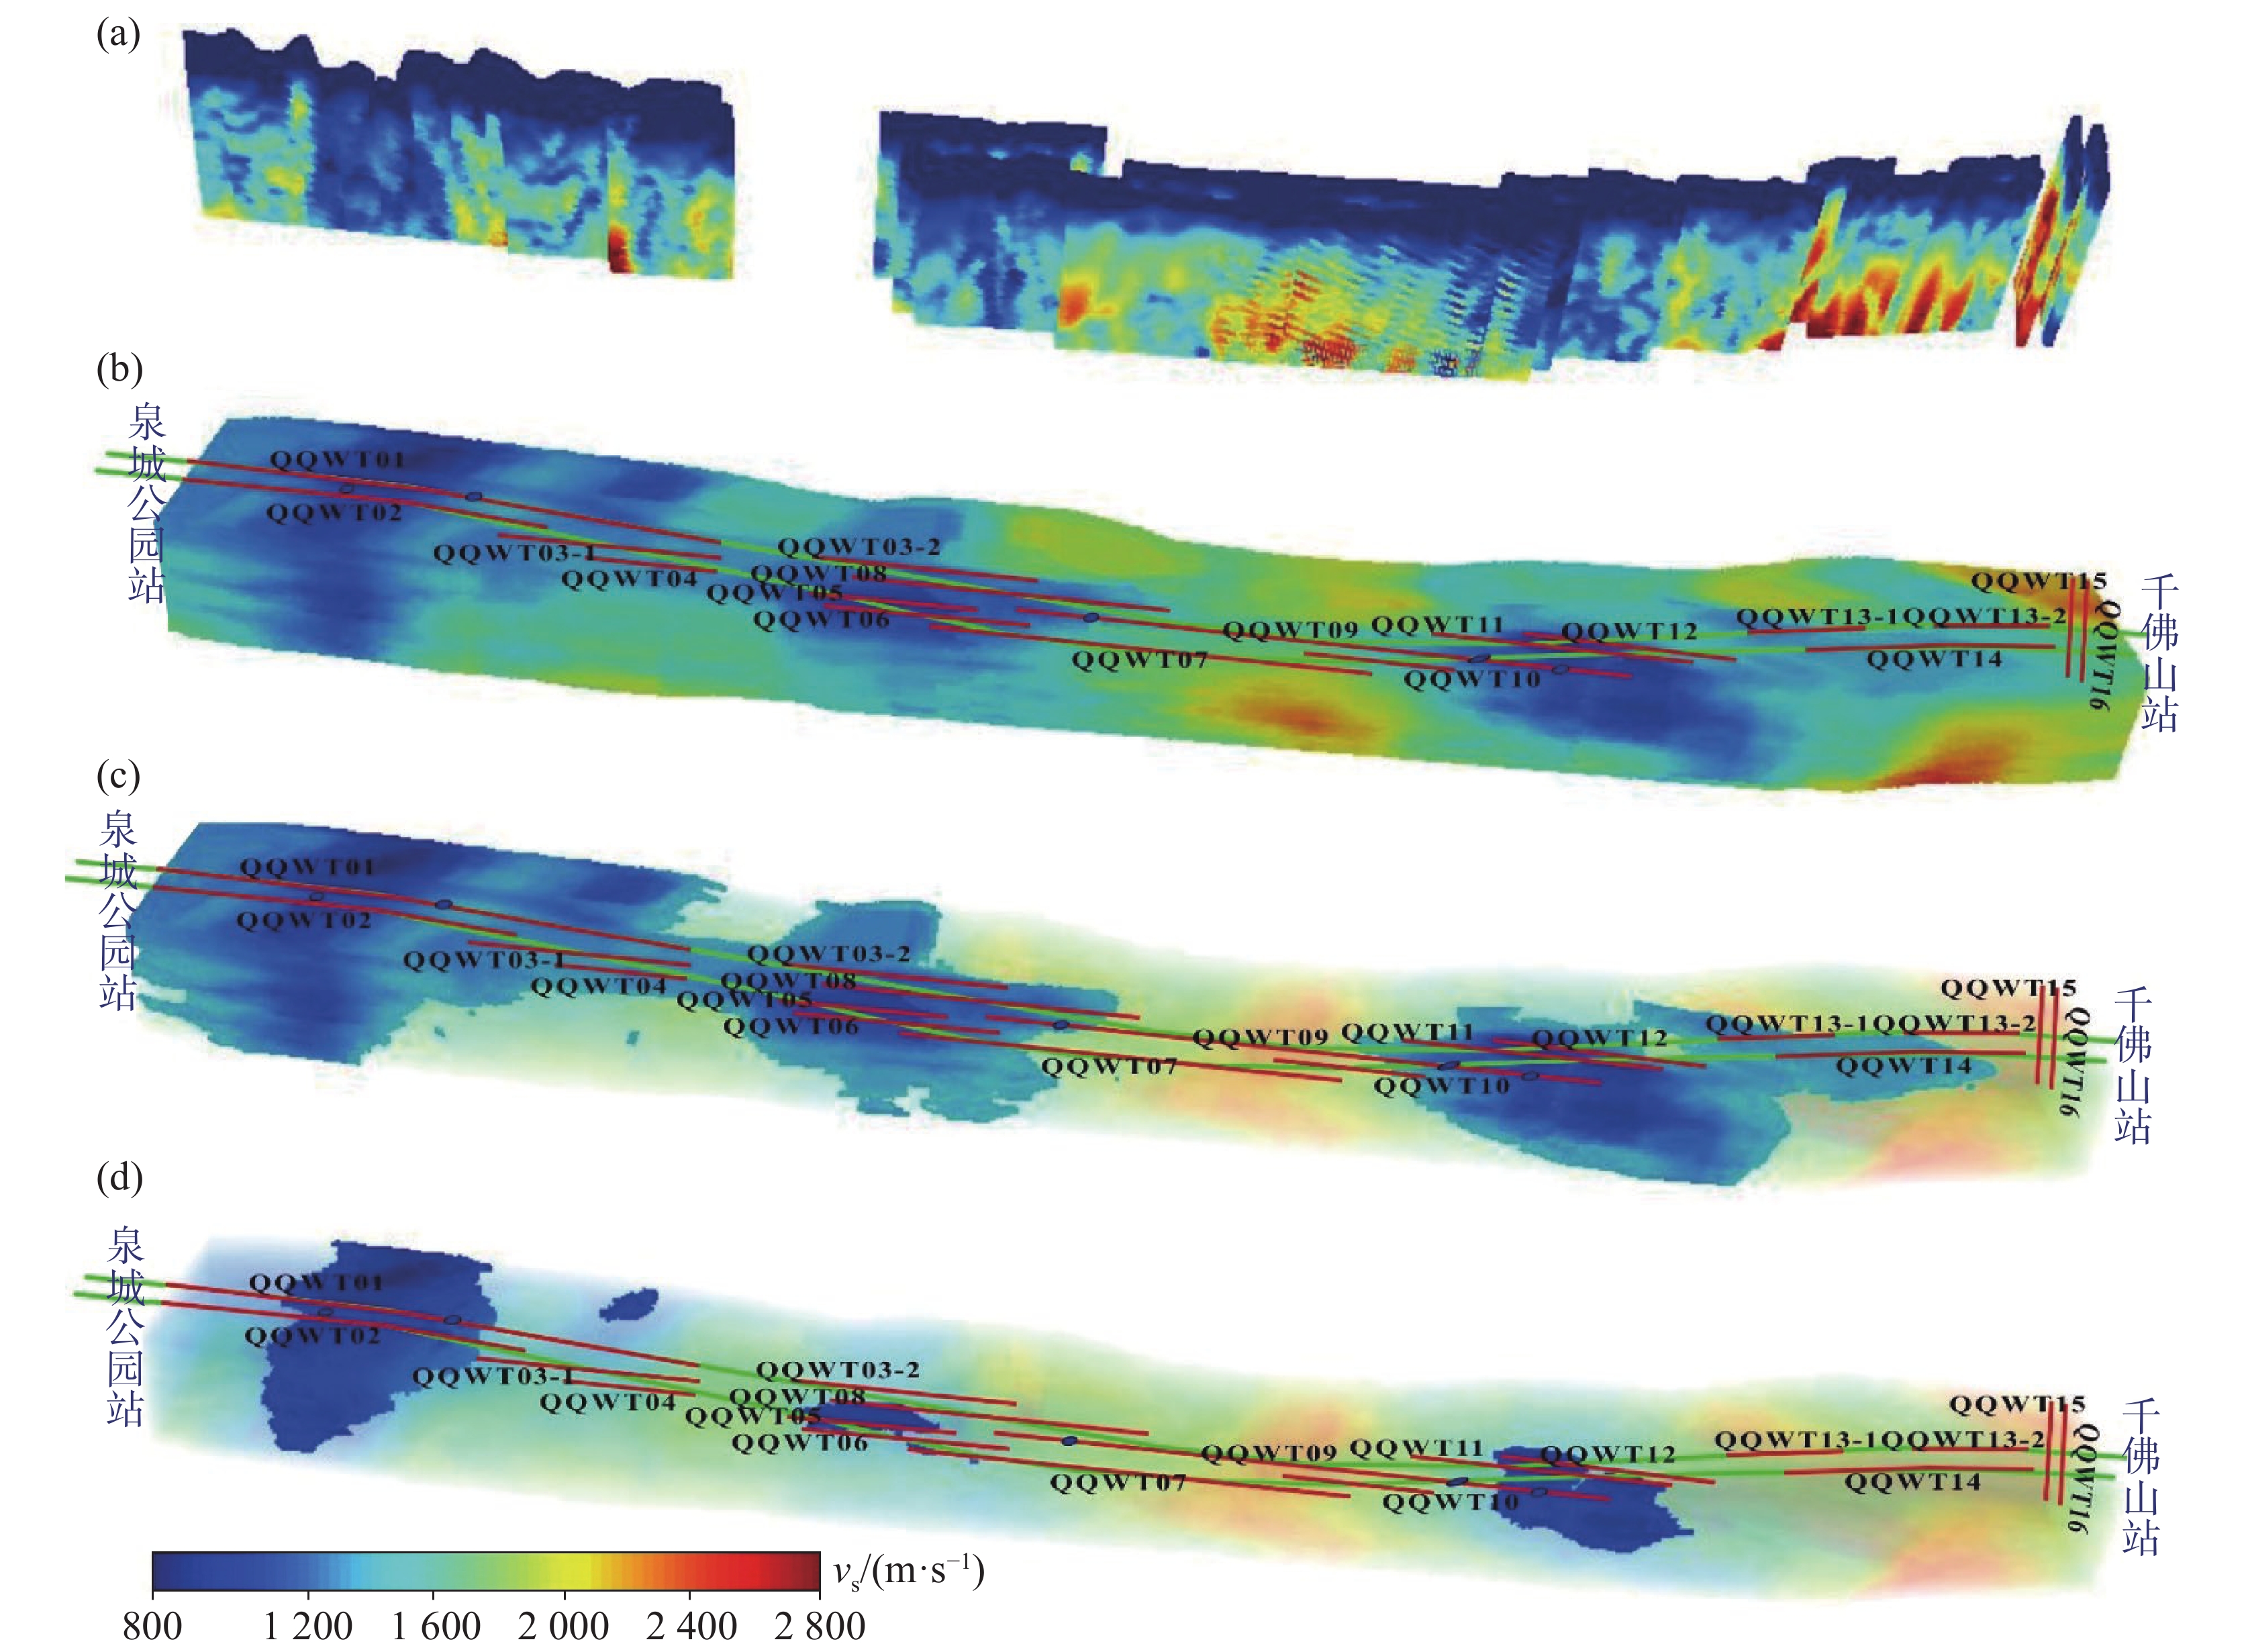
图 5 三维建模结果可视化
(a.二维剖面的三维可视化, b.三维建模地质体可视化,c.岩溶发育区(不透明蓝色区域)可视化,d.溶洞高发区(不透明蓝色区域)可视化)
Figure 5. Visualization of 3D modeling results
(a. visualization of 3D modeling results overlaid with 2D profile visualization, b. visualization of 3D modeling for geological bodies, c. visualization of karst development areas, d. visualization of the high incidence area of caves)
表 1 研究区地层岩性特征
Table 1. Lithological characteristics of the strata in the study area
年代地层 岩性 特征描述 平均厚度/m Q 素填土 黄褐色,以粉质黏土为主,表层0.4~0.6 m多见植物根系,为耕土,属高压缩性土 1.95 杂填土 黄褐色–杂色,以粉质黏土为主,混有较多碎石及少量建筑垃圾,属中压缩性土 1.54 黏土 棕黄色–棕红色,局部可塑,土质不均匀,可见铁锰质氧化物,黏粒含量较高,含有少量碎石,径2~5 cm,含最5%~8%,分布不均 3.11 碎石 棕褐色–灰黄色,碎石成分以白云岩碎块为主,磨圆度一般,多数呈次棱角状,亚圆状,块径2~5 cm,最长12 cm,含量55%~65%,泥质胶结,胶结差,少量钙质胶结,黏性土充填,属低压缩性土 2.42 黏土 棕褐色–棕红色,局部硬塑,黏粒含量高,含有少量碎石,径3~8 cm,分布不均,含最8%~10%,见铁锰质氧化物,属中压缩性土 1.03 Є4O1s 中风化白云岩 青灰色、浅灰色,隐晶质结构,块状构造,节理裂隙较发育,多方解石岩脉充填,岩心多呈柱状,短柱状,柱长8~40 cm,锤击声脆,溶蚀发育,溶孔局部呈蜂窝状,可见小溶洞,黏性土充填,采取率80%~90%,RQD=10~70;岩石坚硬程度为较硬–坚硬岩,岩体完整程度为较破碎;产状:335°∠13° 7.82 溶蚀破碎白云岩 青灰色,隐晶质结构,巨厚层状构造,节理裂隙较发育,多方解石岩脉充填,岩芯多呈碎块状,局部短柱状,块径3~7 cm,柱长5~10 cm,锤击声脆,岩溶溶蚀较发育,可见小溶洞,黏性土充填,采取率70%~80%,RQD=0 3.21 溶洞填充物 杂色,以棕红色黏性土充填,含有基岩风化碎屑物;或黏性土混白云岩碎块充填;或空洞无充填 1.69  下载: 导出CSV
表 2 研究区岩石物性统计表
Table 2. Statistics of rock physical properties in the study area
岩性 波阻抗×104/(g·cm−2·s−1) 横波传播速度/(m·s−1) 纵波传播速度/(m·s−1) 第四系沉积物 5~65 200~ 2500 500~ 2800 灰岩、白云岩 40~116 1500 ~3500 2000~ 6250
下载: 导出CSV
表 3 变差函数建模参数
Table 3. Variogram function modeling parameters
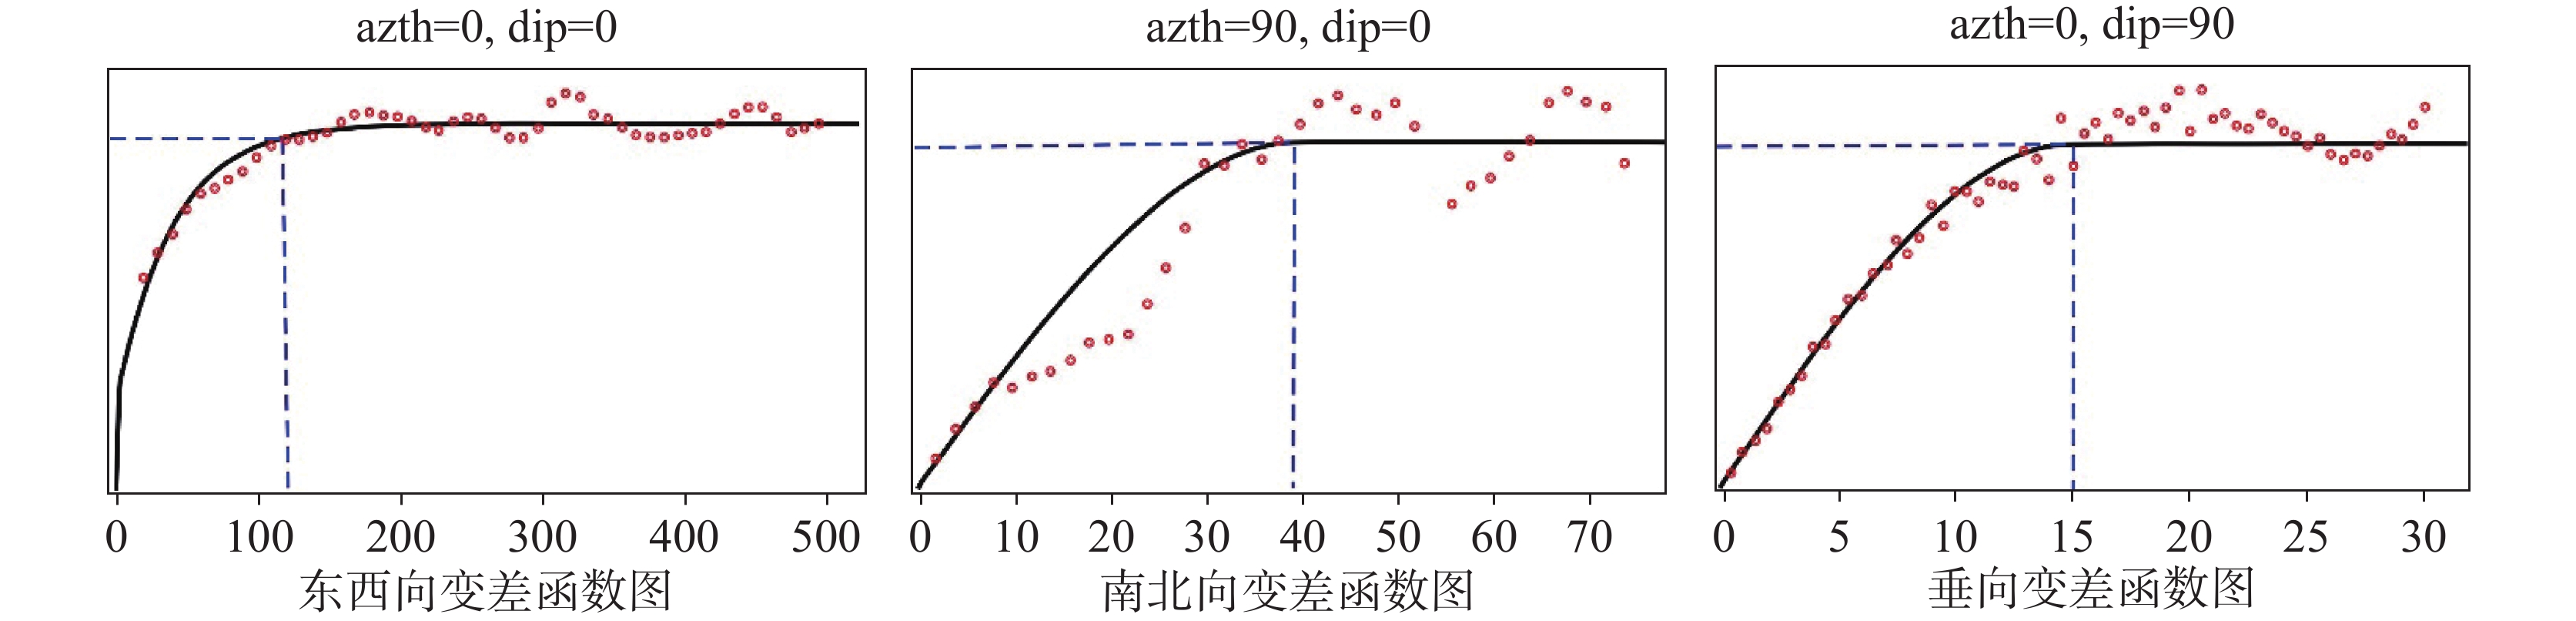
类型 指数型 变程 变程Max 120 变程Med 40 变程Min 15 角度 方位角 0 倾角 0 斜角 0
下载: 导出CSV
-
[1] 吴亚楠, 杨云涛, 焦玉国, 刘志涛, 王延岭, 翟代廷, 周绍智, 魏凯, 程凤. 山东省岩溶塌陷发育特征及诱因分析[J]. 中国岩溶, 2023, 42(1): 128-138, 148.Wu Ya’nan, Yang Yuntao, Jiao Yuguo, Liu Zhitao, Wang Yanling, Zhai Daiting, Zhou Shaozhi, Wei Kai, Cheng Feng. Analysis on development characteristics and inducement of karst collapse in ShandongProvince[J]. Carsologica Sinica, 2023, 42(1): 128-138, 148. [2] Gutiérrez F, Parise M, De Waele J, Jourde H. A review on natural and human-induced geohazards and impacts in karst[J]. Earth-Science Reviews, 2014, 138: 61-88. doi: 10.1016/j.earscirev.2014.08.002 [3] Chalikakis K, Plagnes V, Guerin V, Valois R, Bosch F P. Contribution of geophysical methods to karst-system exploration: An overview[J]. Hydrogeology Journal, 2011, 19: 1169-1180. doi: 10.1007/s10040-011-0746-x [4] 李华, 王东辉, 张伟, 杨剑, 王桥, 廖国忠, 王春山, 韩浩东, 席振铢, 王亮, 刘胜, 夏友刚, 李颖, 杨涛. 地球物理方法在城市地质结构精细化探测中最优方法组合研究: 以成都市天府新区为例[J]. 中国地质, 2023, 50(6): 1691-1704.Li Hua, Wang Donghui, Zhang Wei, Yang Jian, Wang Qiao, Liao Guozhong, Wang Chunshan, Han Haodong, Xi Zhenzhu, Wang Liang, Liu Sheng, Xia Yougang, Li Ying, Yang Tao. The application effect of geophysical method in fine exploration of urban geological structure and study of optimal combination method: A case study of Tianfu New Area in Chengdu, Sichuan Province[J]. Geology in China, 2023, 50(6): 1691-1704. [5] Okada H, Suto K, Asten M W. The microtremor survey method[M]. Tulsa, USA: Society of Exploration Geophysicists, 2004. [6] 何正勤, 胡刚, 鲁来玉, 张维, 叶太兰, 沈坤. 云南通海盆地的浅层速度结构[J]. 地球物理学报, 2013, 56(11): 3819-3827.He Zhengqin, Hu Gang, Lu Laiyu, Zhang Wei, Ye Tailan, Shen Kun. The shallow velocity structure for the Tonghai basin in Yunnan[J]. Chinese Journal of Geophysics, 2013, 56(11): 3819-3827. [7] 徐佩芬, 李世豪, 杜建国, 凌苏群, 郭慧丽, 田宝卿. 微动探测: 地层分层和隐伏断裂构造探测的新方法[J]. 岩石学报, 2013, 29(5): 1841-1845.Xu Peifen, Li Shihao, Du Jianguo, Ling Suqun, Guo Huili, Tian Baoqing. Microtermor survey method: A new geophysical method for dividing strata and detecting the buried fault structures[J]. Acta Petrologica Sinica, 2013, 29(5): 1841-1845. [8] 徐佩芬, 侍文, 凌苏群, 郭慧丽, 李志华. 二维微动剖面探测“孤石”: 以深圳地铁7号线为例[J]. 地球物理学报, 2012, 55(6): 2120-2128.Xu Peifen, Shi Wen, Ling Suqun, Guo Huili, Li Zhihua. Mapping spherically weathered "Boulders" using 2D microtremor profiling method: A case study along subway line 7 in Shenzhen[J]. Chinese Journal of Geophysics, 2012, 55(6): 2120-2128. [9] 侯智超, 柴新朝, 方成, 程建闯. 微动技术在轨道交通勘察地质分层中的应用[J]. 工程勘察, 2024, 52(6): 65-71.Hou Zhichao, Chai Xinchao, Fang Cheng, Cheng Jianchuang, Cheng Jianchuang. Application of microtremor ultrasound technique in geological layering exploration of urban rail transit[J]. Geotechnical Investigation & Surveying, 2024, 52(6): 65-71. [10] 邬健强, 陈 松, 徐俊杰, 郑智杰, 刘永亮, 王越. 被动源面波法在城市居民区建筑间的应用[J]. 中国岩溶, 2023, 42(6): 1322-1330.Wu Jianqiang, Chen Song, Xu Junjie, Zheng Zhijie, Liu Yongliang, Wang Yue, Zheng Zhijie, Liu Yongliang, Wang Yue. Application of the method of passive surface wave to the exploration of urban residential area[J]. Carsologica Sinica, 2023, 42(6): 1322-1330. [11] 刘伟, 甘伏平, 赵伟, 陈玉玲. 高密度电法与微动技术组合在岩溶塌陷分区中的应用分析: 以广西来宾吉利塌陷为例[J]. 中国岩溶, 2014, 33(1): 118-122.Liu Wei, Gan Fuping, Zhao Wei, Chen Yuling. Application analysis of combining high density resistivity and microtremor survey methods in areas of karst collapse: A case study of the collapse in Jili village, Laibin, Guangxi[J]. Carsologica Sinica, 2014, 33(1): 118-122. [12] 张中, 冯文成, 林杨. 微动探测技术在盾构隧道穿越城区岩溶地层中的应用[J]. 物探与化探, 2025, 49(2): 520-528.Zhang Zhong, Feng Wencheng, Lin Yang. Application of microtremor survey technology in shield tunnels Passing through urban karst formation[J]. Geophysical and Geochemical Exploration, 2025, 49(2): 520-528. [13] Tolosana-Delgado R, Mueller U, Vanden Boogaart K G, Pawlowsky-Glahn V, Egozcue J J. Geostatistics for compositional data: an overview[J]. Mathematical Geosciences, 2019, 51: 485-526. doi: 10.1007/s11004-018-9769-3 [14] Oliver M A, Webster R. A tutorial guide to geostatistics: Computing and modelling variograms and kriging[J]. Catena, 2014, 113: 56-69. doi: 10.1016/j.catena.2013.09.006 [15] Høyer A S, Vignoli G, Hansen T M, Vu L T, A Keefer D, Jørgensen F. Multiple-point statistical simulation for hydrogeological models: 3-D training image development and conditioning strategies[J]. Hydrology and Earth System Sciences, 2017, 21: 6069-6089. doi: 10.5194/hess-21-6069-2017 [16] 张文彪, 段太忠, 何治亮, 赵华伟, 刘彦锋, 鲍典. 碳酸盐岩古溶洞层级约束地质建模方法探讨: 以塔河油田奥陶系某缝洞单元为例[J]. 地质科技通报, 2022, 41(3): 273-281. doi: 10.19509/j.cnki.dzkq.2021.0067Zhang Wenbiao, Duan Taizhong, He Zhiliang, Zhao Huawei, Liu Yanfeng, Bao Dian. Hierarchical constraint geological modelling method for carbonate paleokarst caves: A case study of Ordovician fracture-cavern unit in Tahe Oilfield[J]. Bulletin of Geological Science and Technology, 2022, 41(3): 273-281. doi: 10.19509/j.cnki.dzkq.2021.0067 [17] 邰文星, 周琦, 杨成富, 吴冲龙, 赵平, 刘建中, 王泽鹏, 何金坪, 刘光富. 黔西南者相金矿床三维地质可视化建模及应用[J]. 地球科学, 2023, 48(11): 4017-4033.Tai Wenxing, Zhou Qi, Yang Chengfu, Wu Chonglong, Zhao Ping, Liu Jianzhong, Wang Zepeng, He Jinping, Liu Guangfu. 3D geological visualization modeling and its application in Zhexiang gold deposit, Southwest Guizhou Province[J]. Earth Science, 2023, 48(11): 4017-4033. [18] 杨丽芝, 曲万龙, 刘春华, 尚浩, 祈晓凡. 济南城市工程地质条件分区及轨道交通建设适宜性研究[J]. 水资源与水工程学报, 2012, 23(6): 120-123.Yang Lizhi, Qu Wanlong, Liu Chunhua, Shang Hao, Qi Xiaofan. Analysis of suitability about the division of engineering geological condition and rail transit construction in Jinan urbon area[J]. Journal of Water Resources & Water Engineering, 2012, 23(6): 120-123. -

 点击查看大图

计量
- 文章访问数: 44
- HTML浏览量: 23
- PDF下载量: 21
- 被引次数: 0
