


Intelligent identification method for karst depressions in railway construction areas: A case study of Enshi area, Hubei Province
-
摘要: 文章针对湖北省恩施地区复杂岩溶地质环境,以宜涪铁路选线区南部为研究对象,开展岩溶洼地智能识别方法探究,以筛选最优识别方案。结果表明:基于地质思维的局部等高线树法结合30 m分辨率数字高程模型(DEM),在等高线间隔为60 m、最小区域面积为
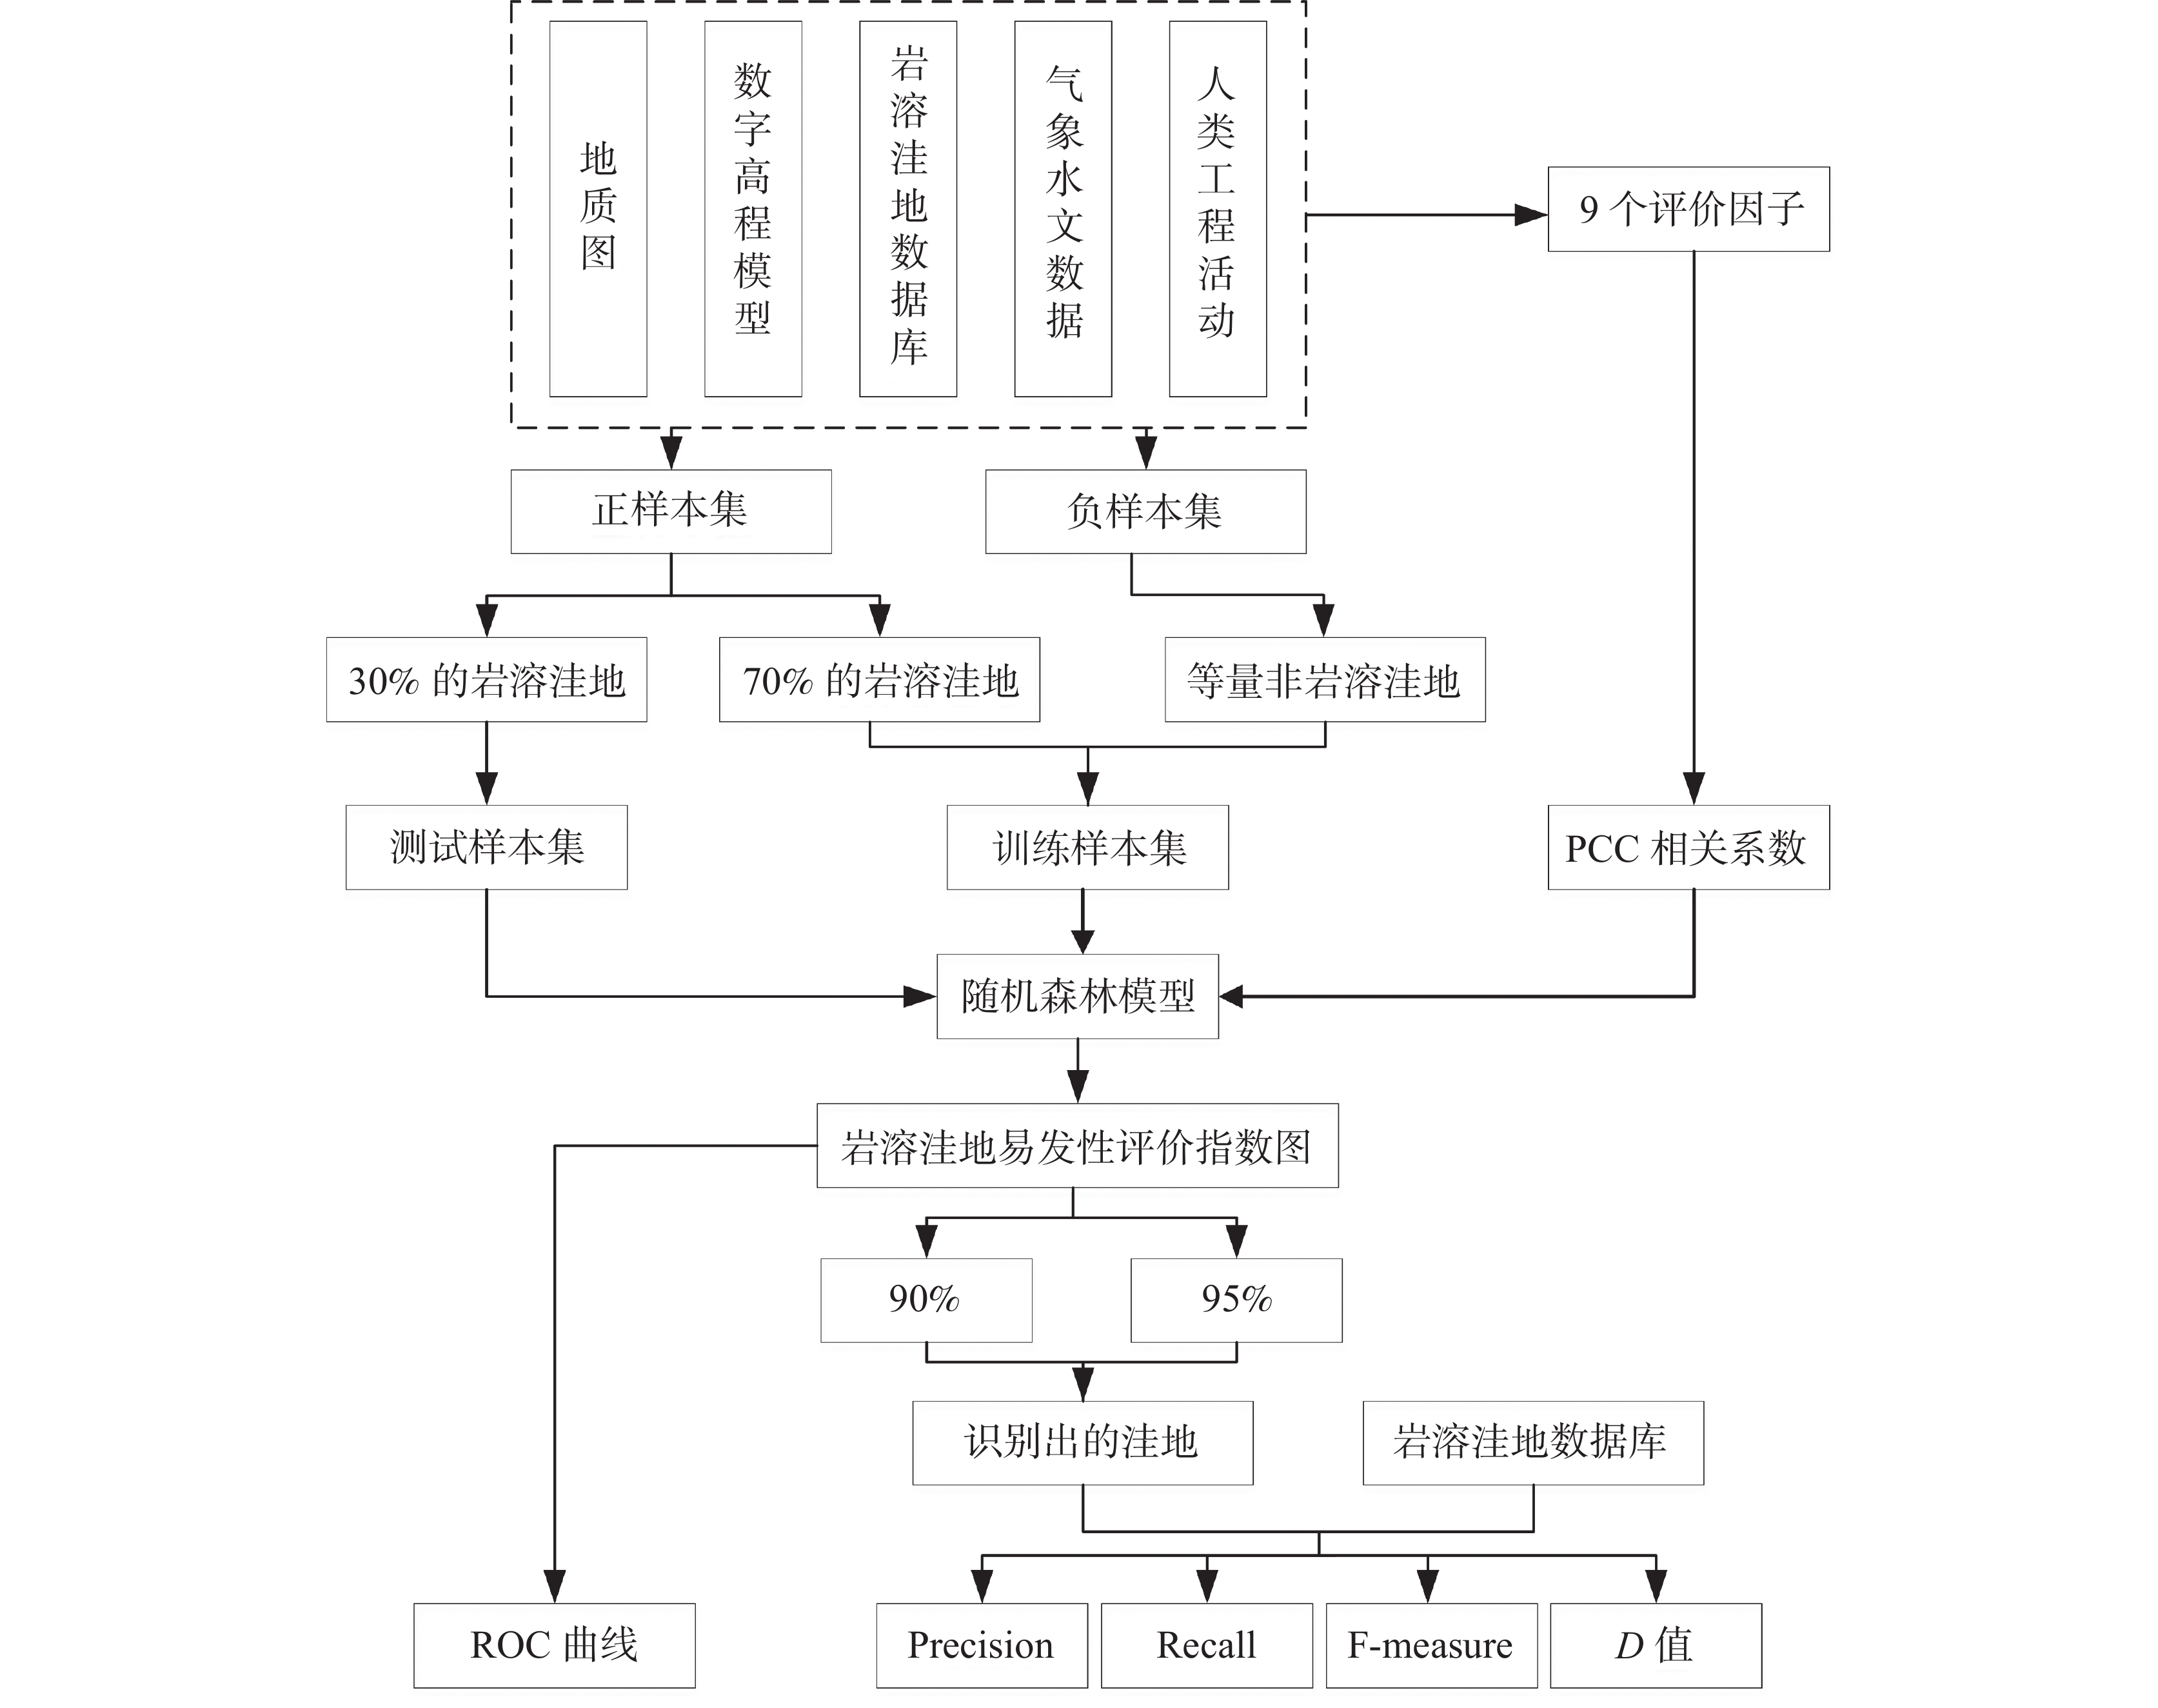
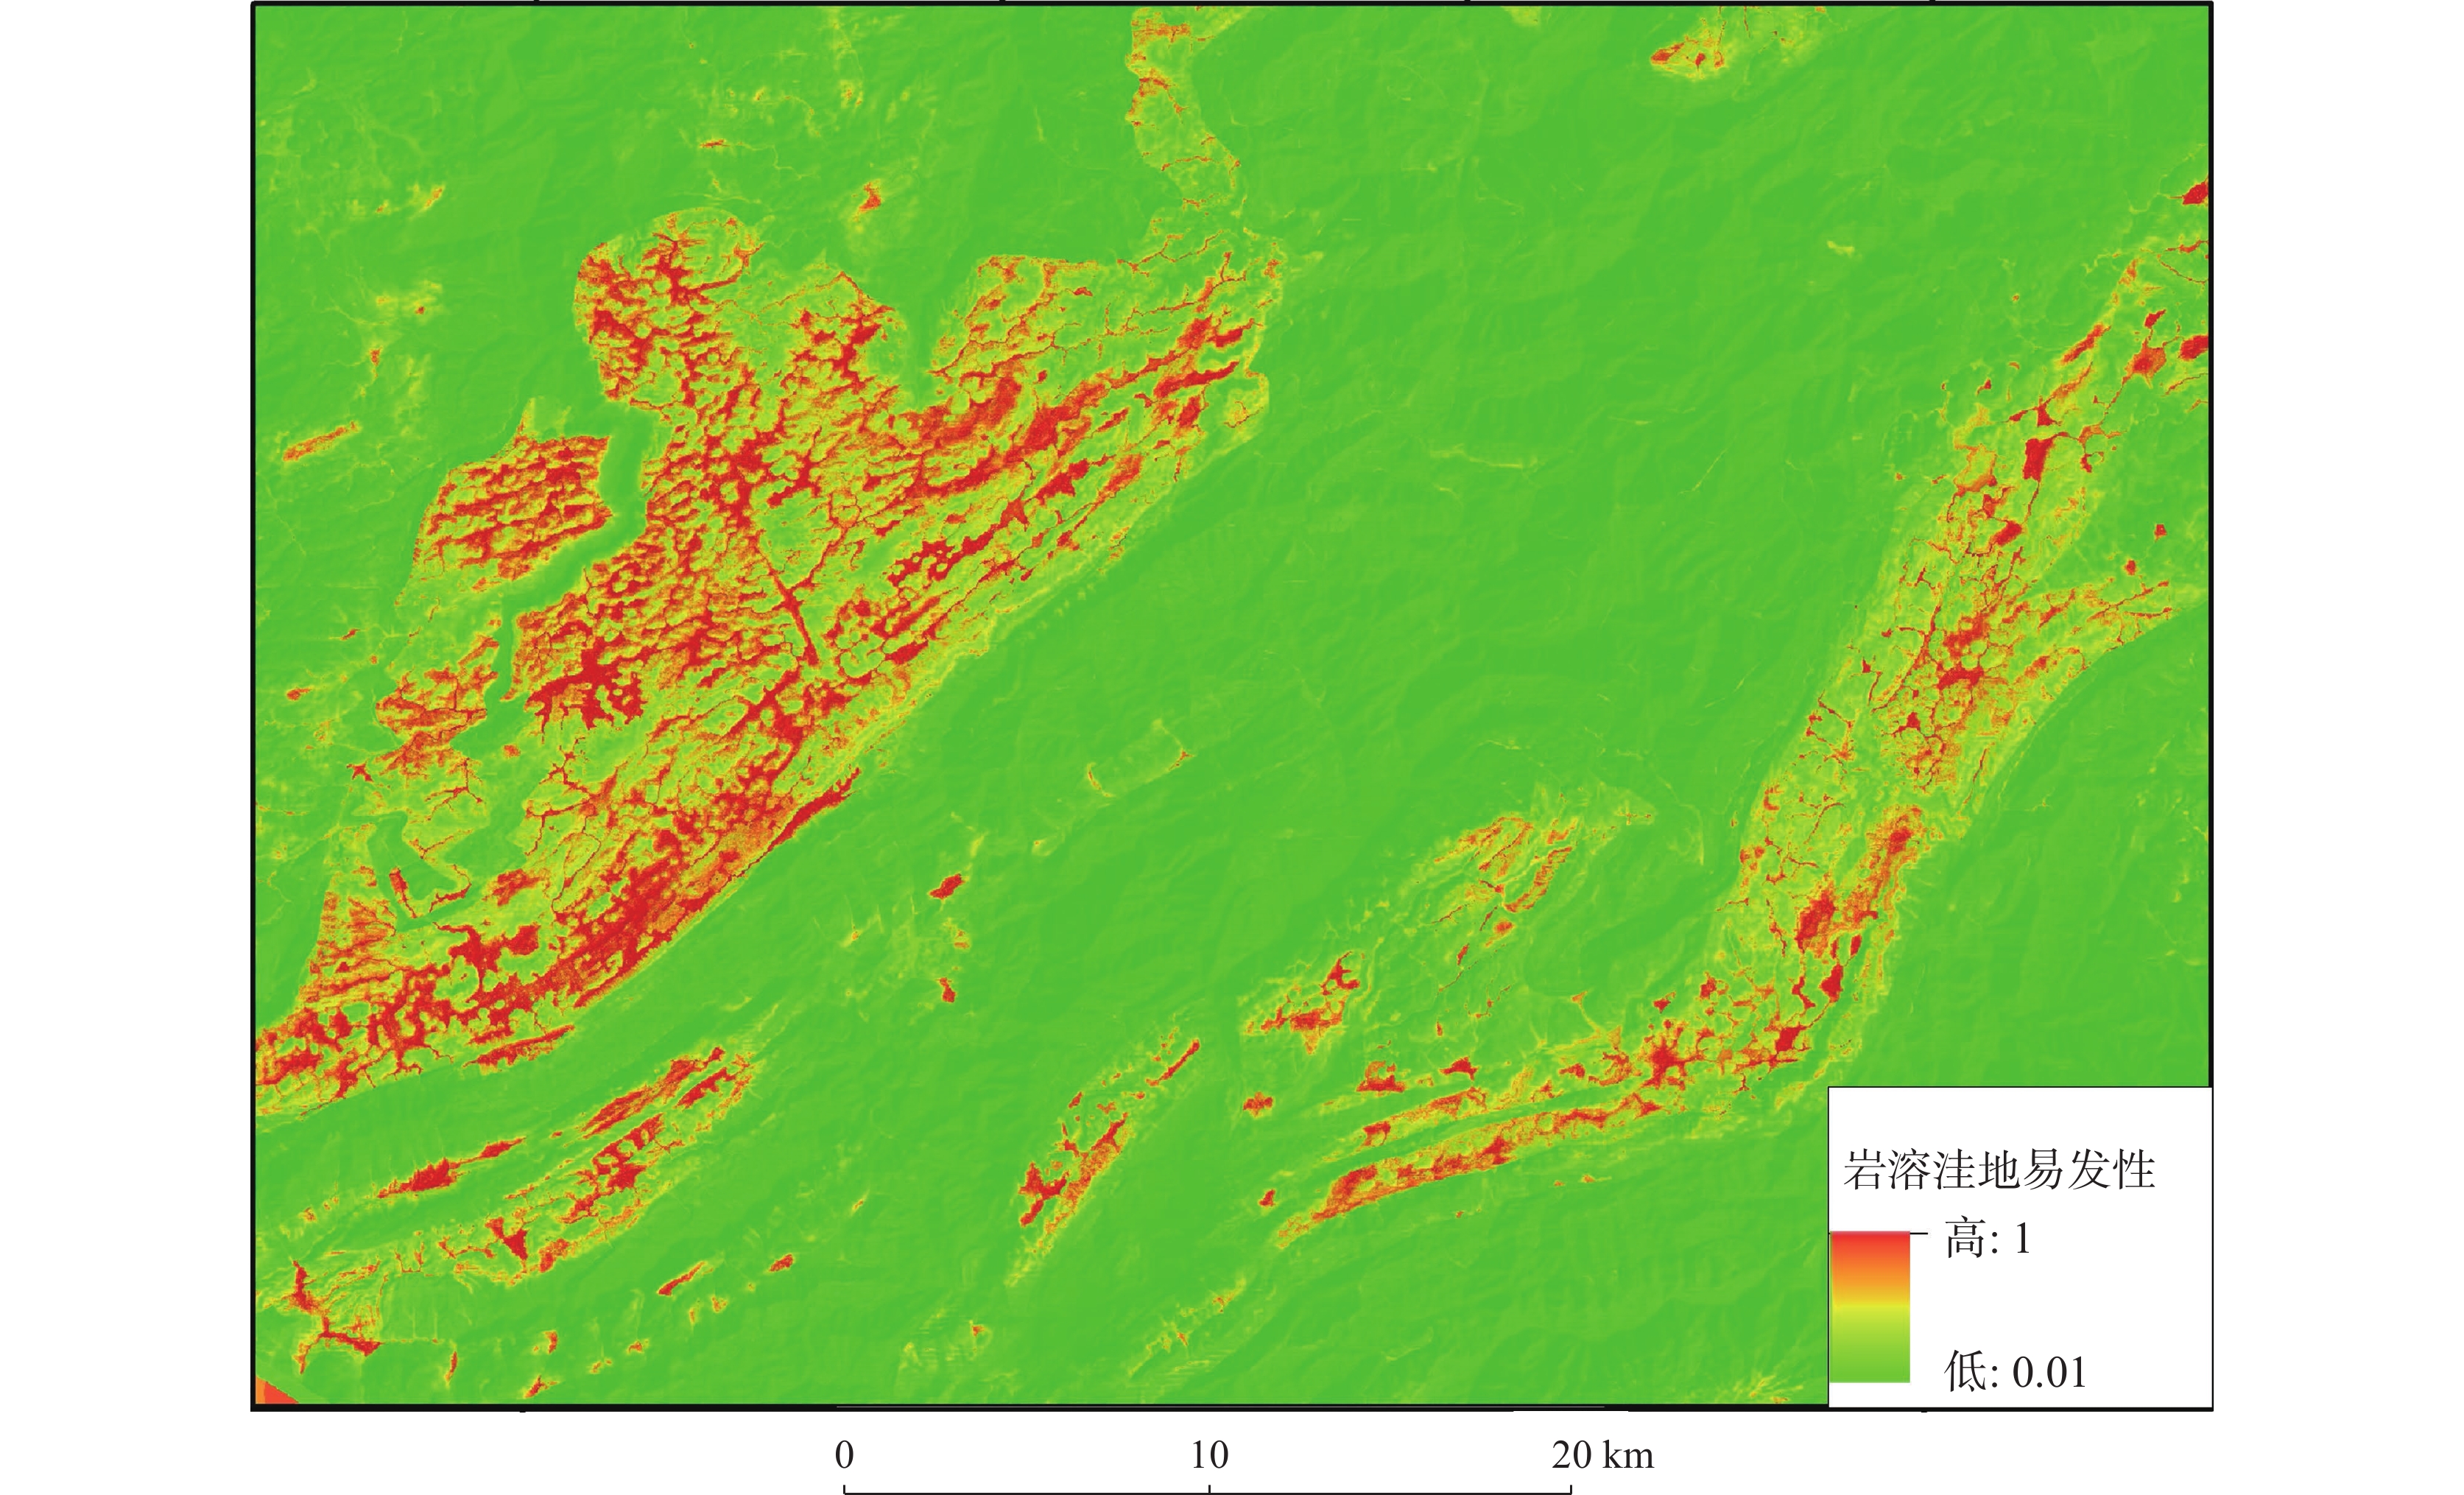
7500 m2时存在最优参数。为验证该方法对不同分辨率DEM的适用性,利用相同步骤对12.5 m分辨率DEM进行实验,结果表明该方法在不同分辨率条件下亦具备良好性能;为进一步验证方法的有效性,引入随机森林机器学习模型进行对比,结果表明:当易发性指数阈值设置为95%时识别效果最佳,但在非岩溶洼地区域,随机森林模型识别出的错误区域明显多于基于地质思维的局部等高线树法,导致其准确率、F-measure和偏差回归精度(6.21%、11.63%、44.34%)均低于等高线树法(66.15%、62.39%、88.33%)。基于地质思维的局部等高线树法在岩溶洼地识别中具有更高的准确性和可靠性。Abstract:The karst geological environment in Enshi is complex, and the extensive development of karst depressions poses significant challenges to railway route planning, construction safety, and cost control. To address these challenges, this study focuses on the southern section of the route selection area of Yichang-Fuling Railway as the core research zone to systematically explore intelligent identification methods for karst depressions. The primary objective is to identify the optimal detection sheme that meets the practical requirements of railway engineering surveys, thereby providing reliable technical support for risk assessment and decision-making during the route selection phase. The study area is located at the northeastern edge of the Yunnan-Guizhou Plateau, and tectonically belonging to the fold belt in the Bamian Mountain Platform of the upper Yangtze Platform. This region features complete exposure of strata, encompassing marine sedimentary sequences from the Cambrian to the middle Triassic Periods,with lithological associations dominated by clastic and carbonate formations. These geological conditions provide a solid material foundation for the development and evolution of karst depressions. In this study, the geology-informed local contour tree method was adopted. Firstly, based on high-precision river system data, a 500 m river buffer zone was established to exclude non-karst areas affected by surface runoff. Meanwhile, the distribution of soluble rocks was accurately extracted from the regional stratigraphic and lithological database, eliminating the interference caused by similar terrain in non-soluble rock areas. Secondly, regional watershed boundaries were delineated through hydrological analysis and calculations, providing a basis for defining the spatial content of potential karst depression development. Finally, by overlaying the river system influence zone, soluble rock distribution, and watershed boundaries, the areas within the river buffer zone were excluded, and the core areas meeting the geological conditions for karst development were retained to generate DEM data of karst-prone regions. This approach effectively reduces the interference caused by non-karst landform features. To scientifically and comprehensively evaluate the identification performance, this study selects classic statistical indicators-accuracy and F-measure-to reflect the overall effectiveness of the method. Addditionally, the concept of deviation regression accuracy (D-value) is introduced to meet the stringent requirements of practical engineering for quantitative precision, as traditional indicators often fail to capture the spatial deviation between identified results and actual karst depressions. Experimental results show that supported by 30 m resolution DEM data, the geology-informed local contour tree method achieves optimal identification performance when the contour interval is set to 60 m and the minimum identified area threshold is 7,500 m2: The accuracy reaches 66.04%, the F-measure is 63.29%, and the D-value is as high as 88.68%. This results indicate that the method can not only effectively identify karst depressions, but also minimize spatial deviations to the greatest extent. To verify the method's applicability to data sources with different resolutions, parallel experiments were conducted on 12.5 m resolution DEM data following the same technical workflow. The results confirm that the method exhibits excellent adaptability and stability across varying resolutions, demonstrating a consistent pattern: For a fixed contour interval, as the minimum area threshold gradually increases, the D-value rises steadily before stabilizing. When the D-value reaches this stable phase, the corresponding parameters are determined as the optimal identification settings-further increasing the minimum area threshold will lead to the misclassification and exclusion of numerous actual karst depressions, thereby failing to meet practical engineering requirements. This finding provides clear guidance for parameter configuration across different data source scenarios, enhancing the method's utility in engineering projects with limited data resources. To further validate the proposed method's superiority, a comparative experiment was conducted using the random forest machine learning model, a widely adopted algorithm in geospatial identification. The results show that the random forest model achieves its best performance when the susceptibility index threshold is set to 95%. However, due to its over-reliance on statistical correlations rather than geological mechanisms, it tends to generate a large number of false positives in non-karst depression areas. Consequently, its accuracy, F-measure, and deviation regression accuracy are only 6.21%, 11.63%, and 44.34%, respectively-far lower than the 66.15%, 62.39%, and 88.33% achieved by the local contour tree method. In conclusion, the geology-informed local contour tree method demonstrates greater accuracy, reliability, and engineering applicability in identifying karst depressions compared to the random forest model. By integrating geological knowledge into the algorithm design, it effectively avoids false identifications caused by pure data-driven models and provides precise spatial information on karst depressions. This study not only enriches the technical system for intelligent karst identification, but also offers scientific and reliable technical support for railway route selection, risk assessment, and engineering construction in karst-prone areas. Therefore, it contributes to the improvement of construction safety and the reduction of engineering risks in complex geological environments. -
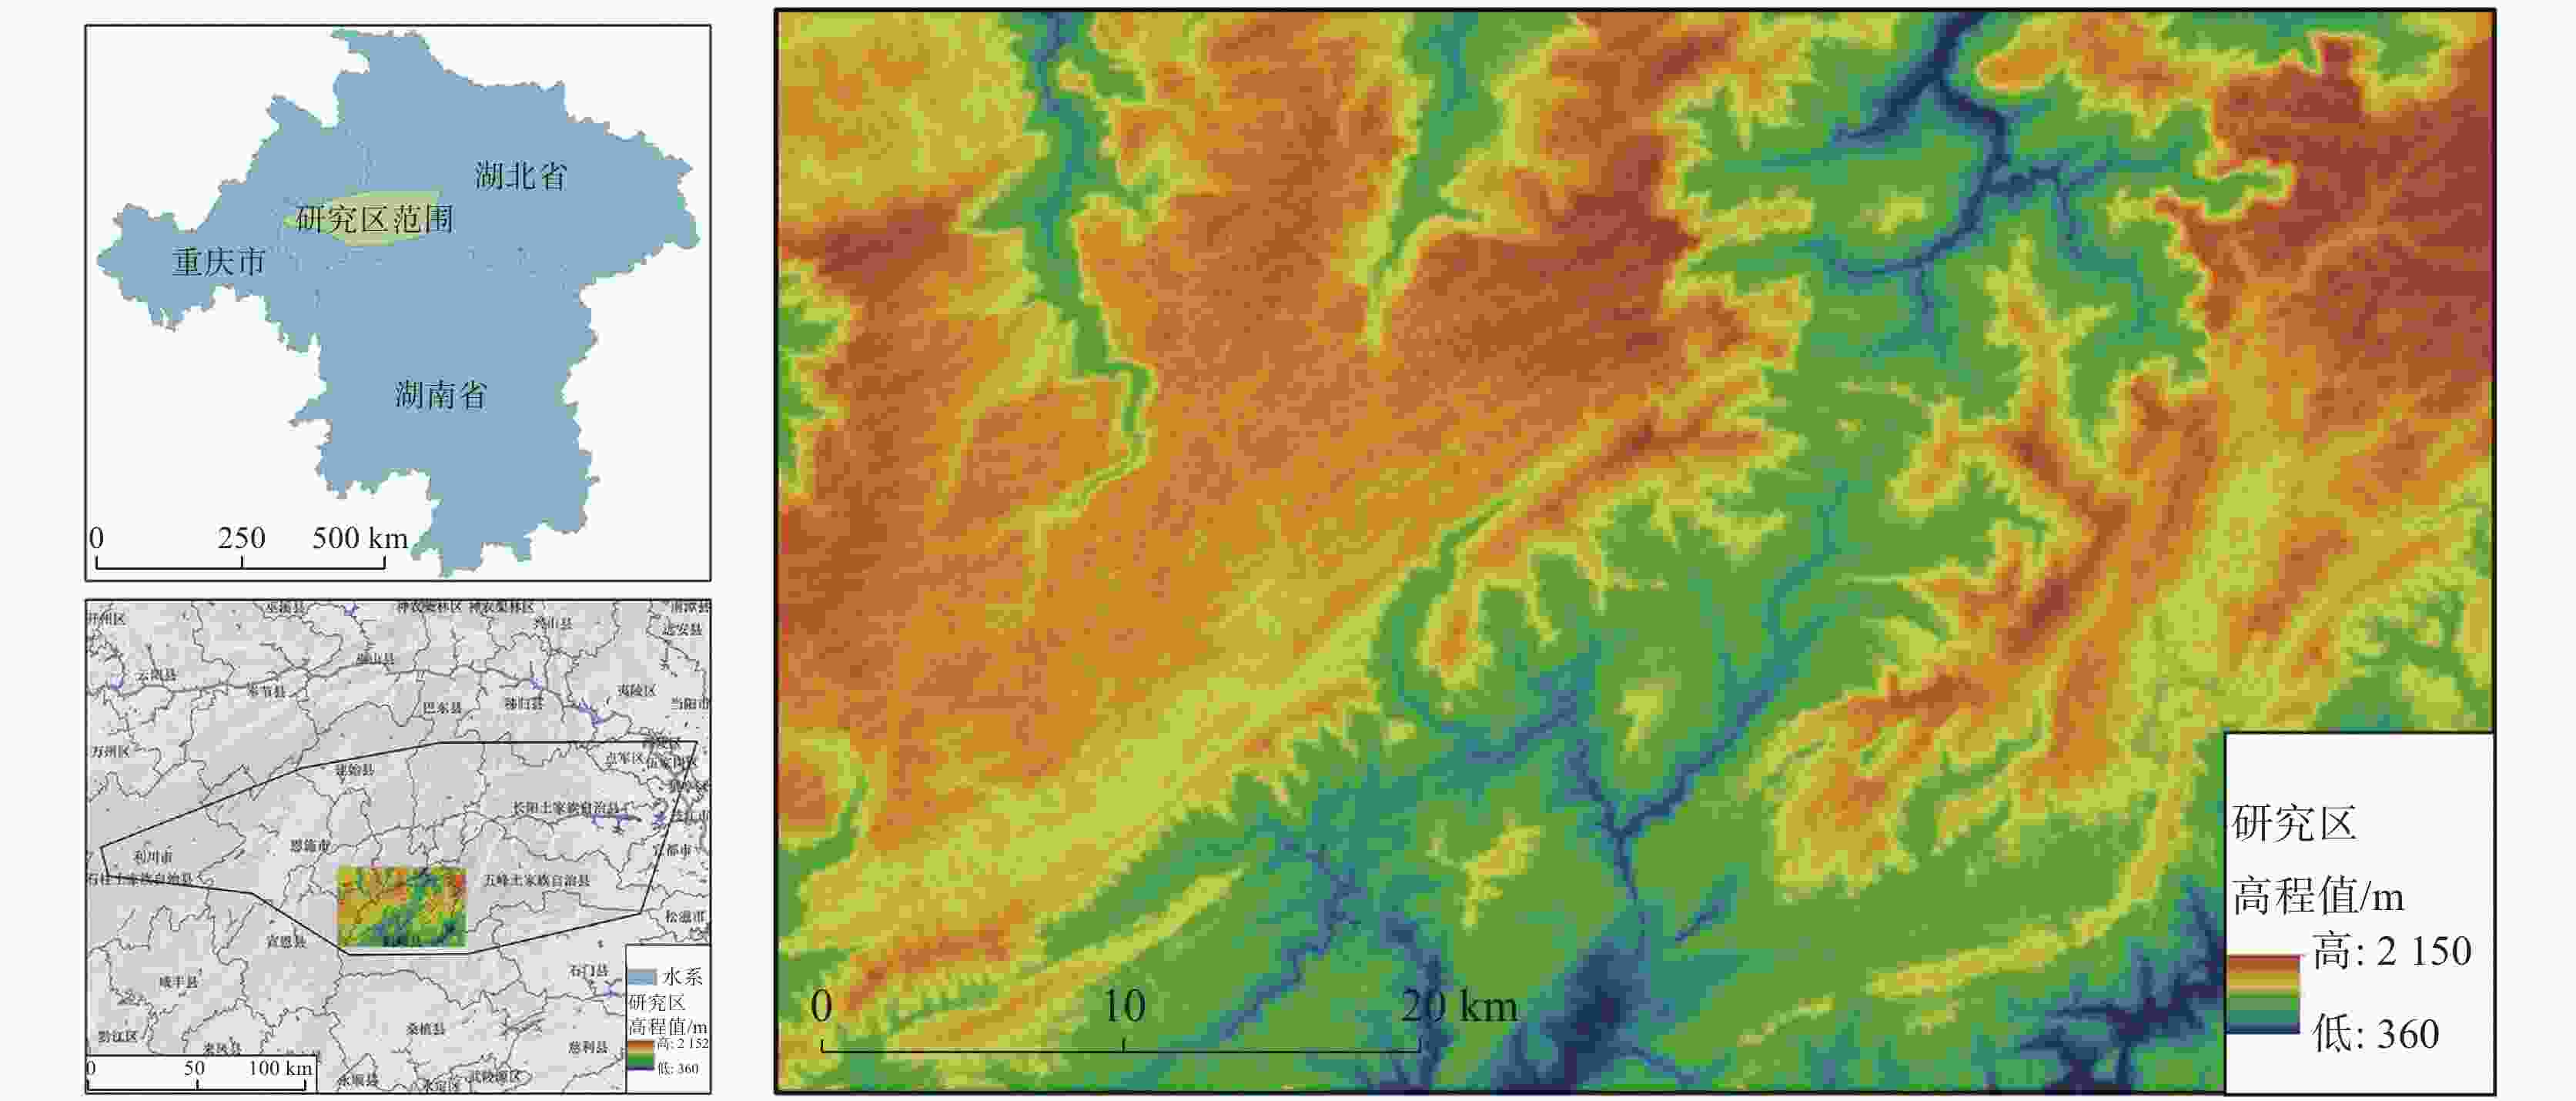
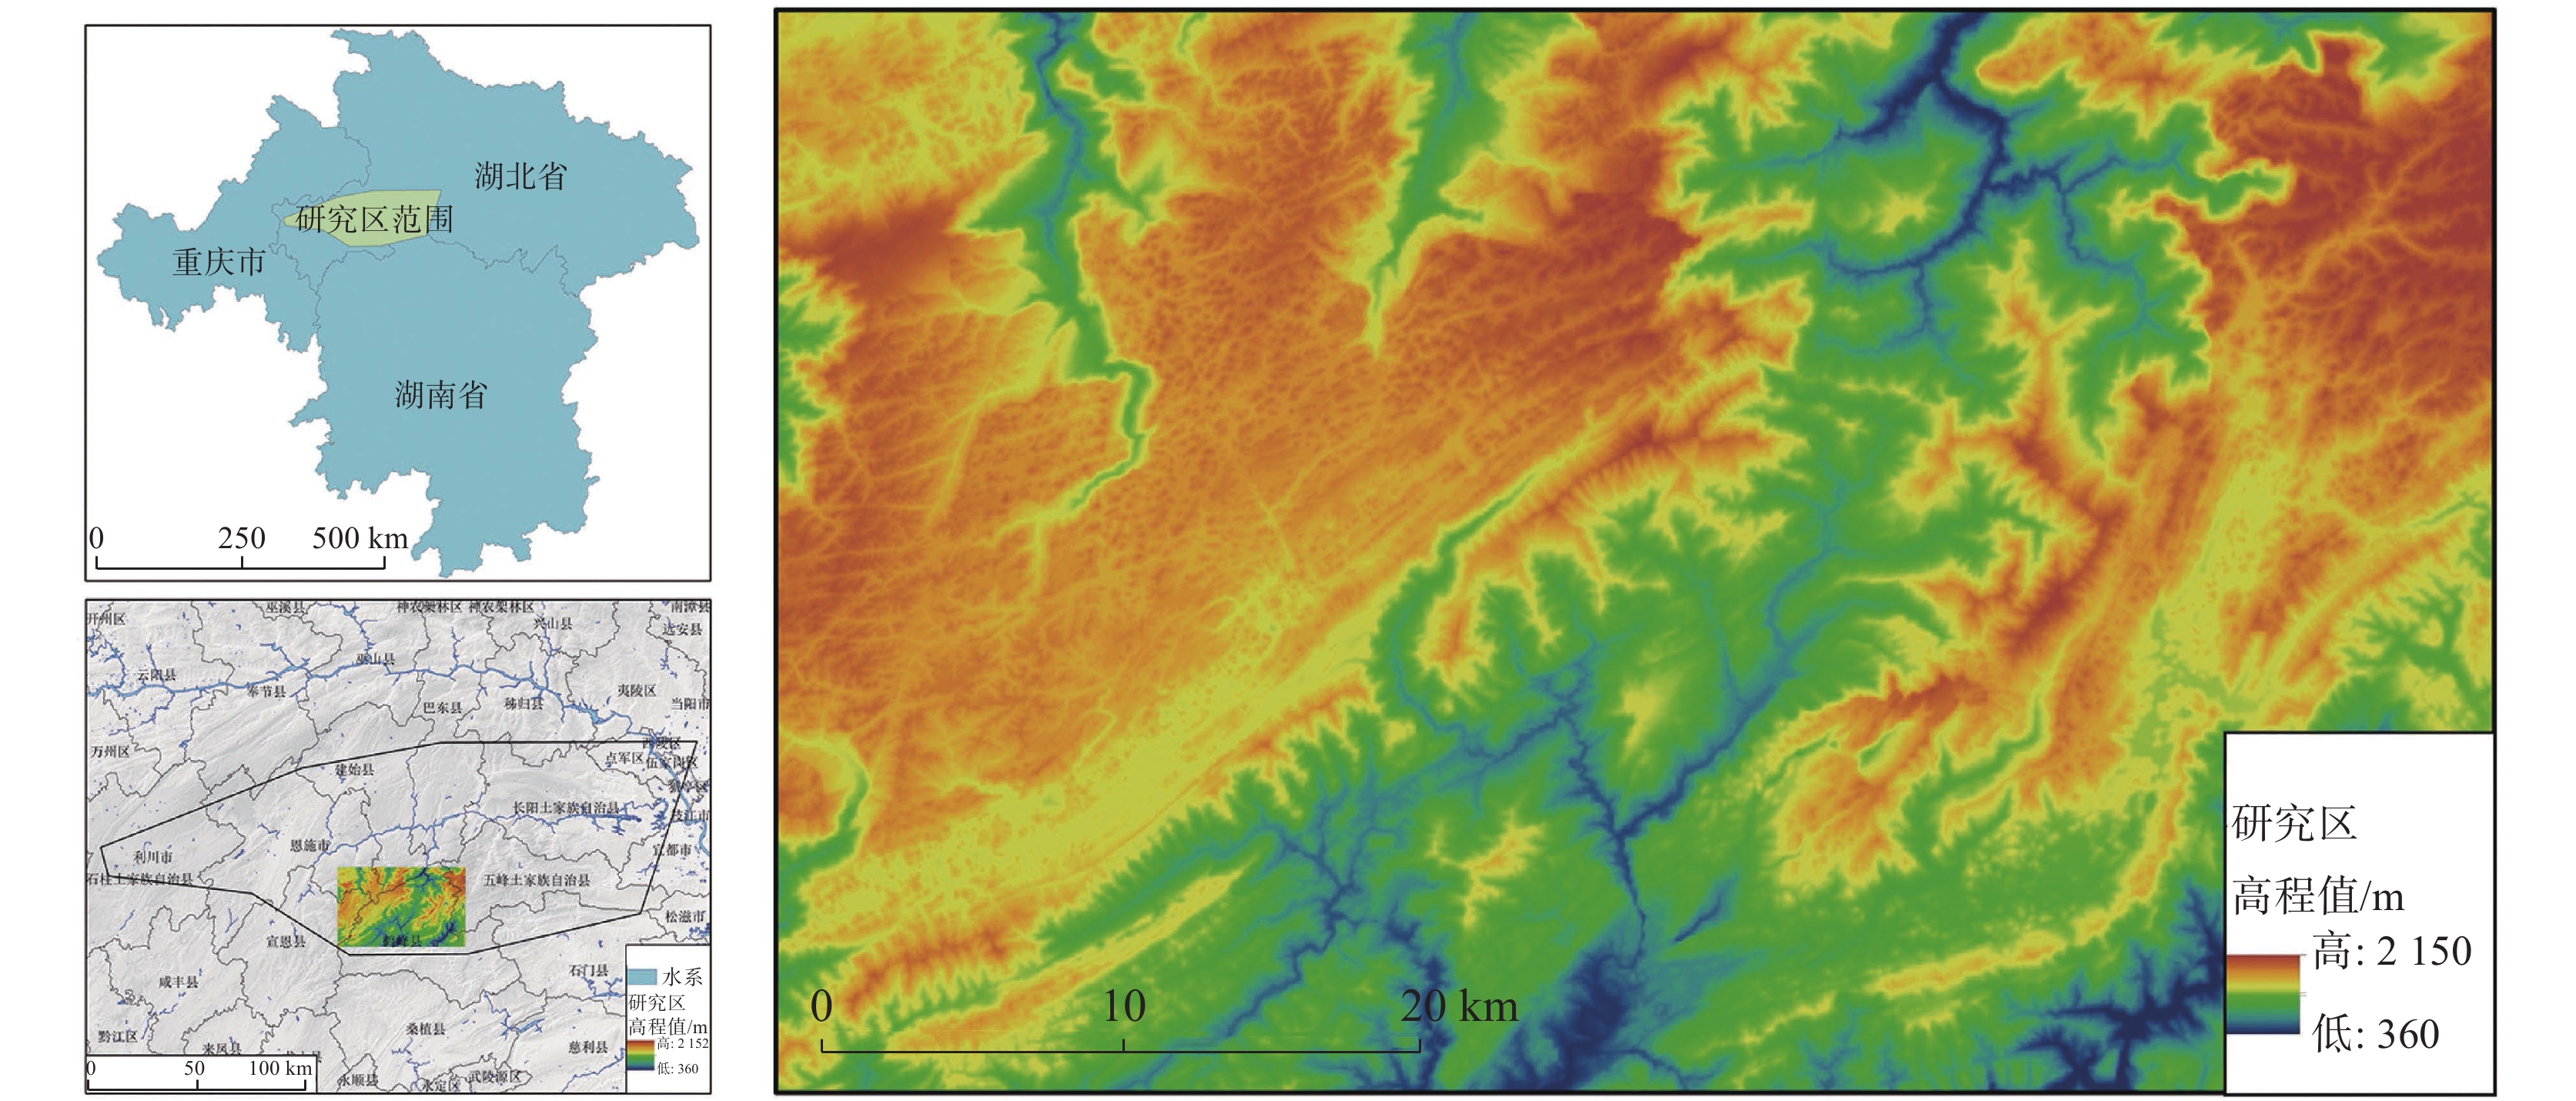
图 1 研究区地理位置示意图
Figure 1. Schematic diagram of the geographical location of the study area
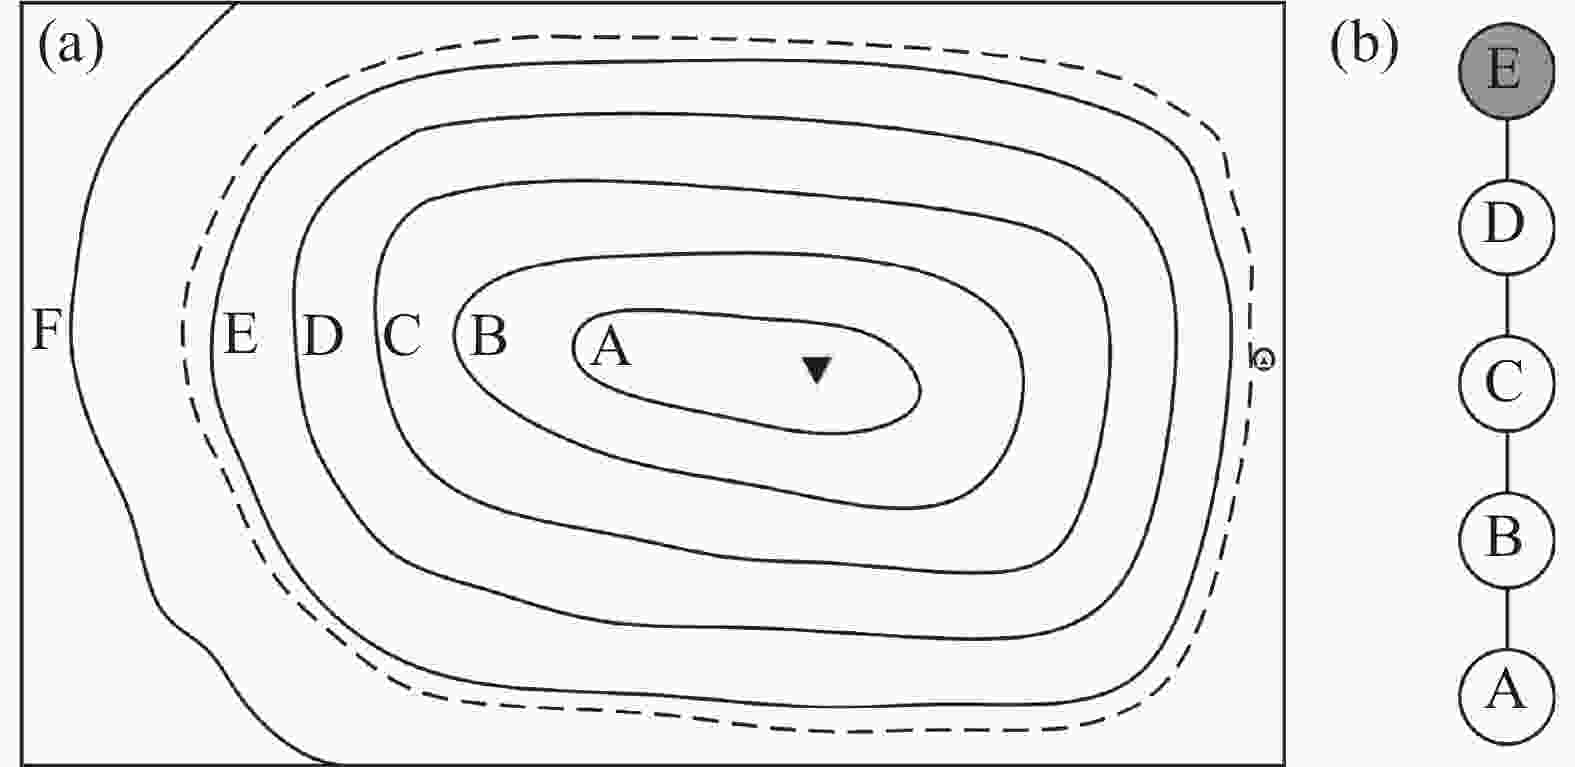
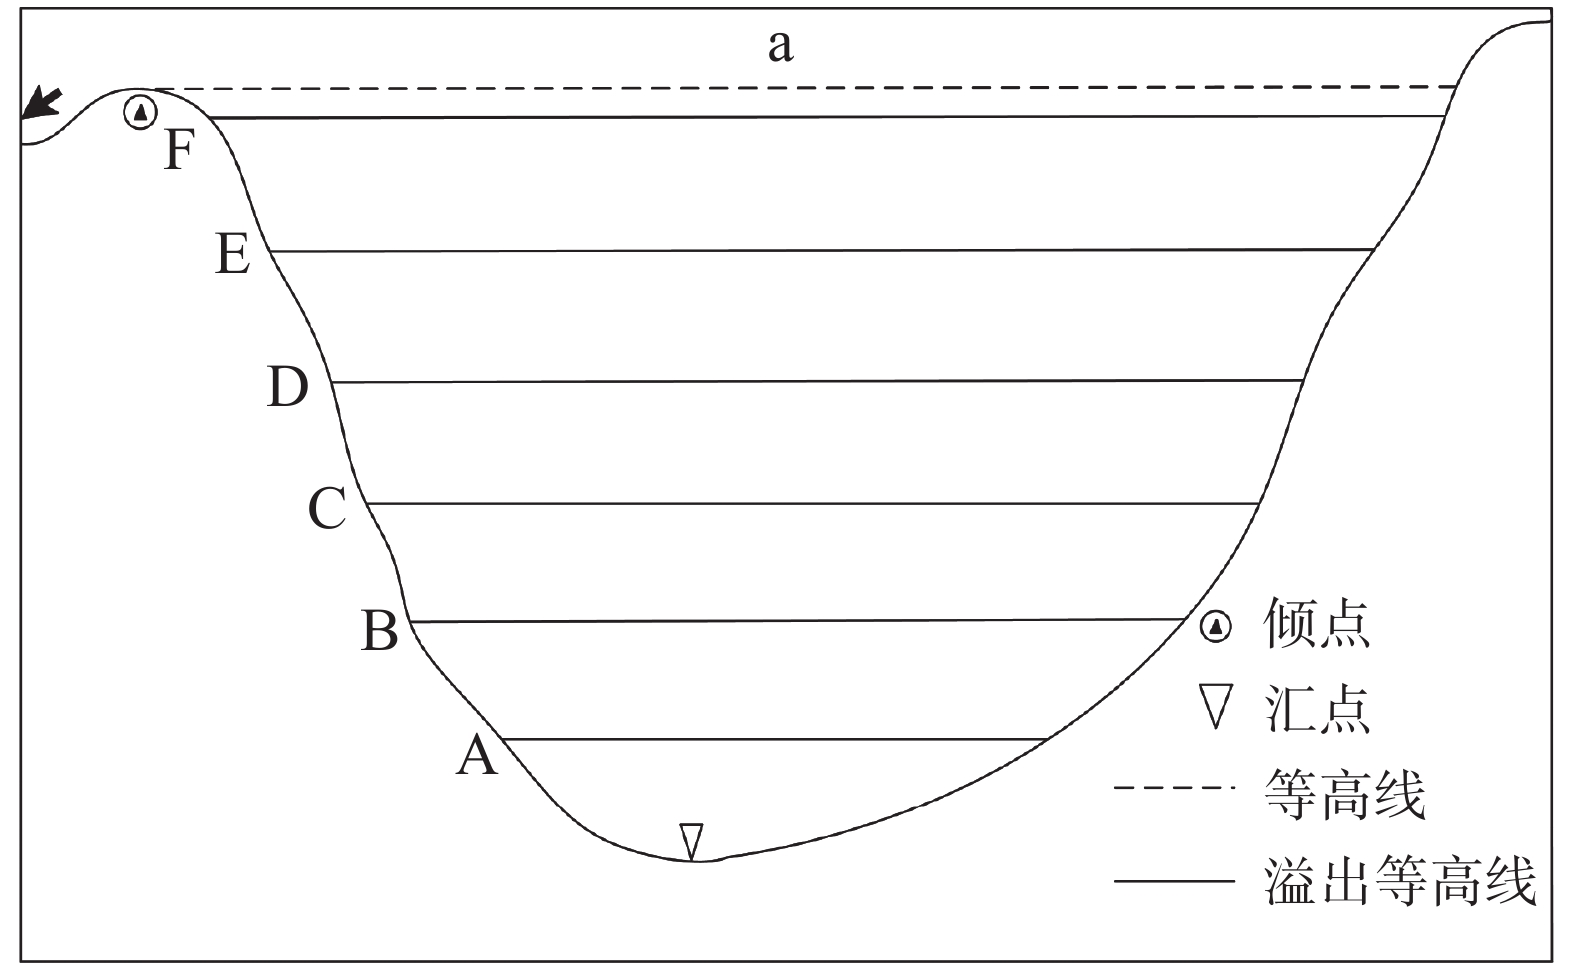
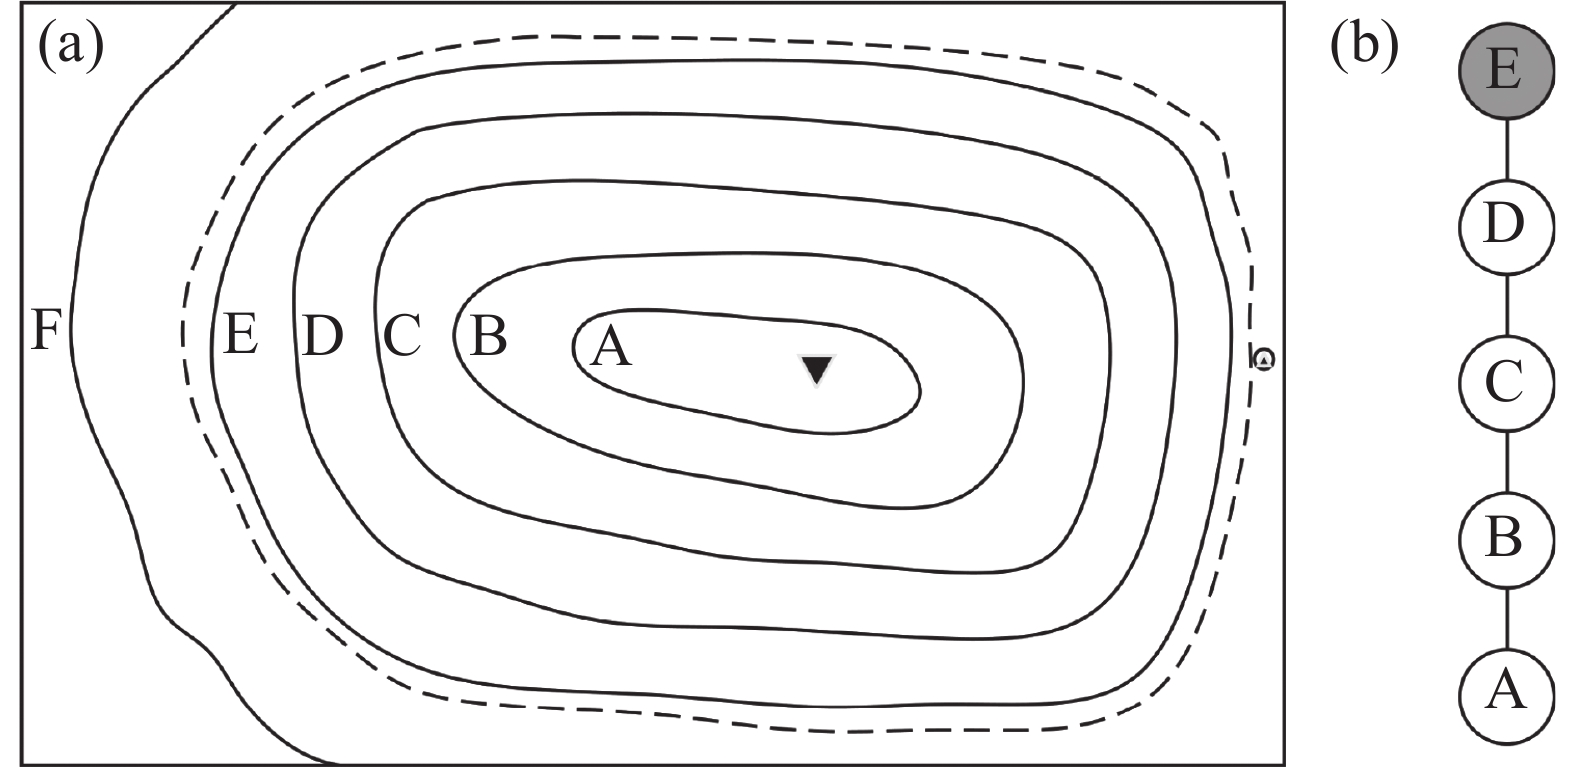
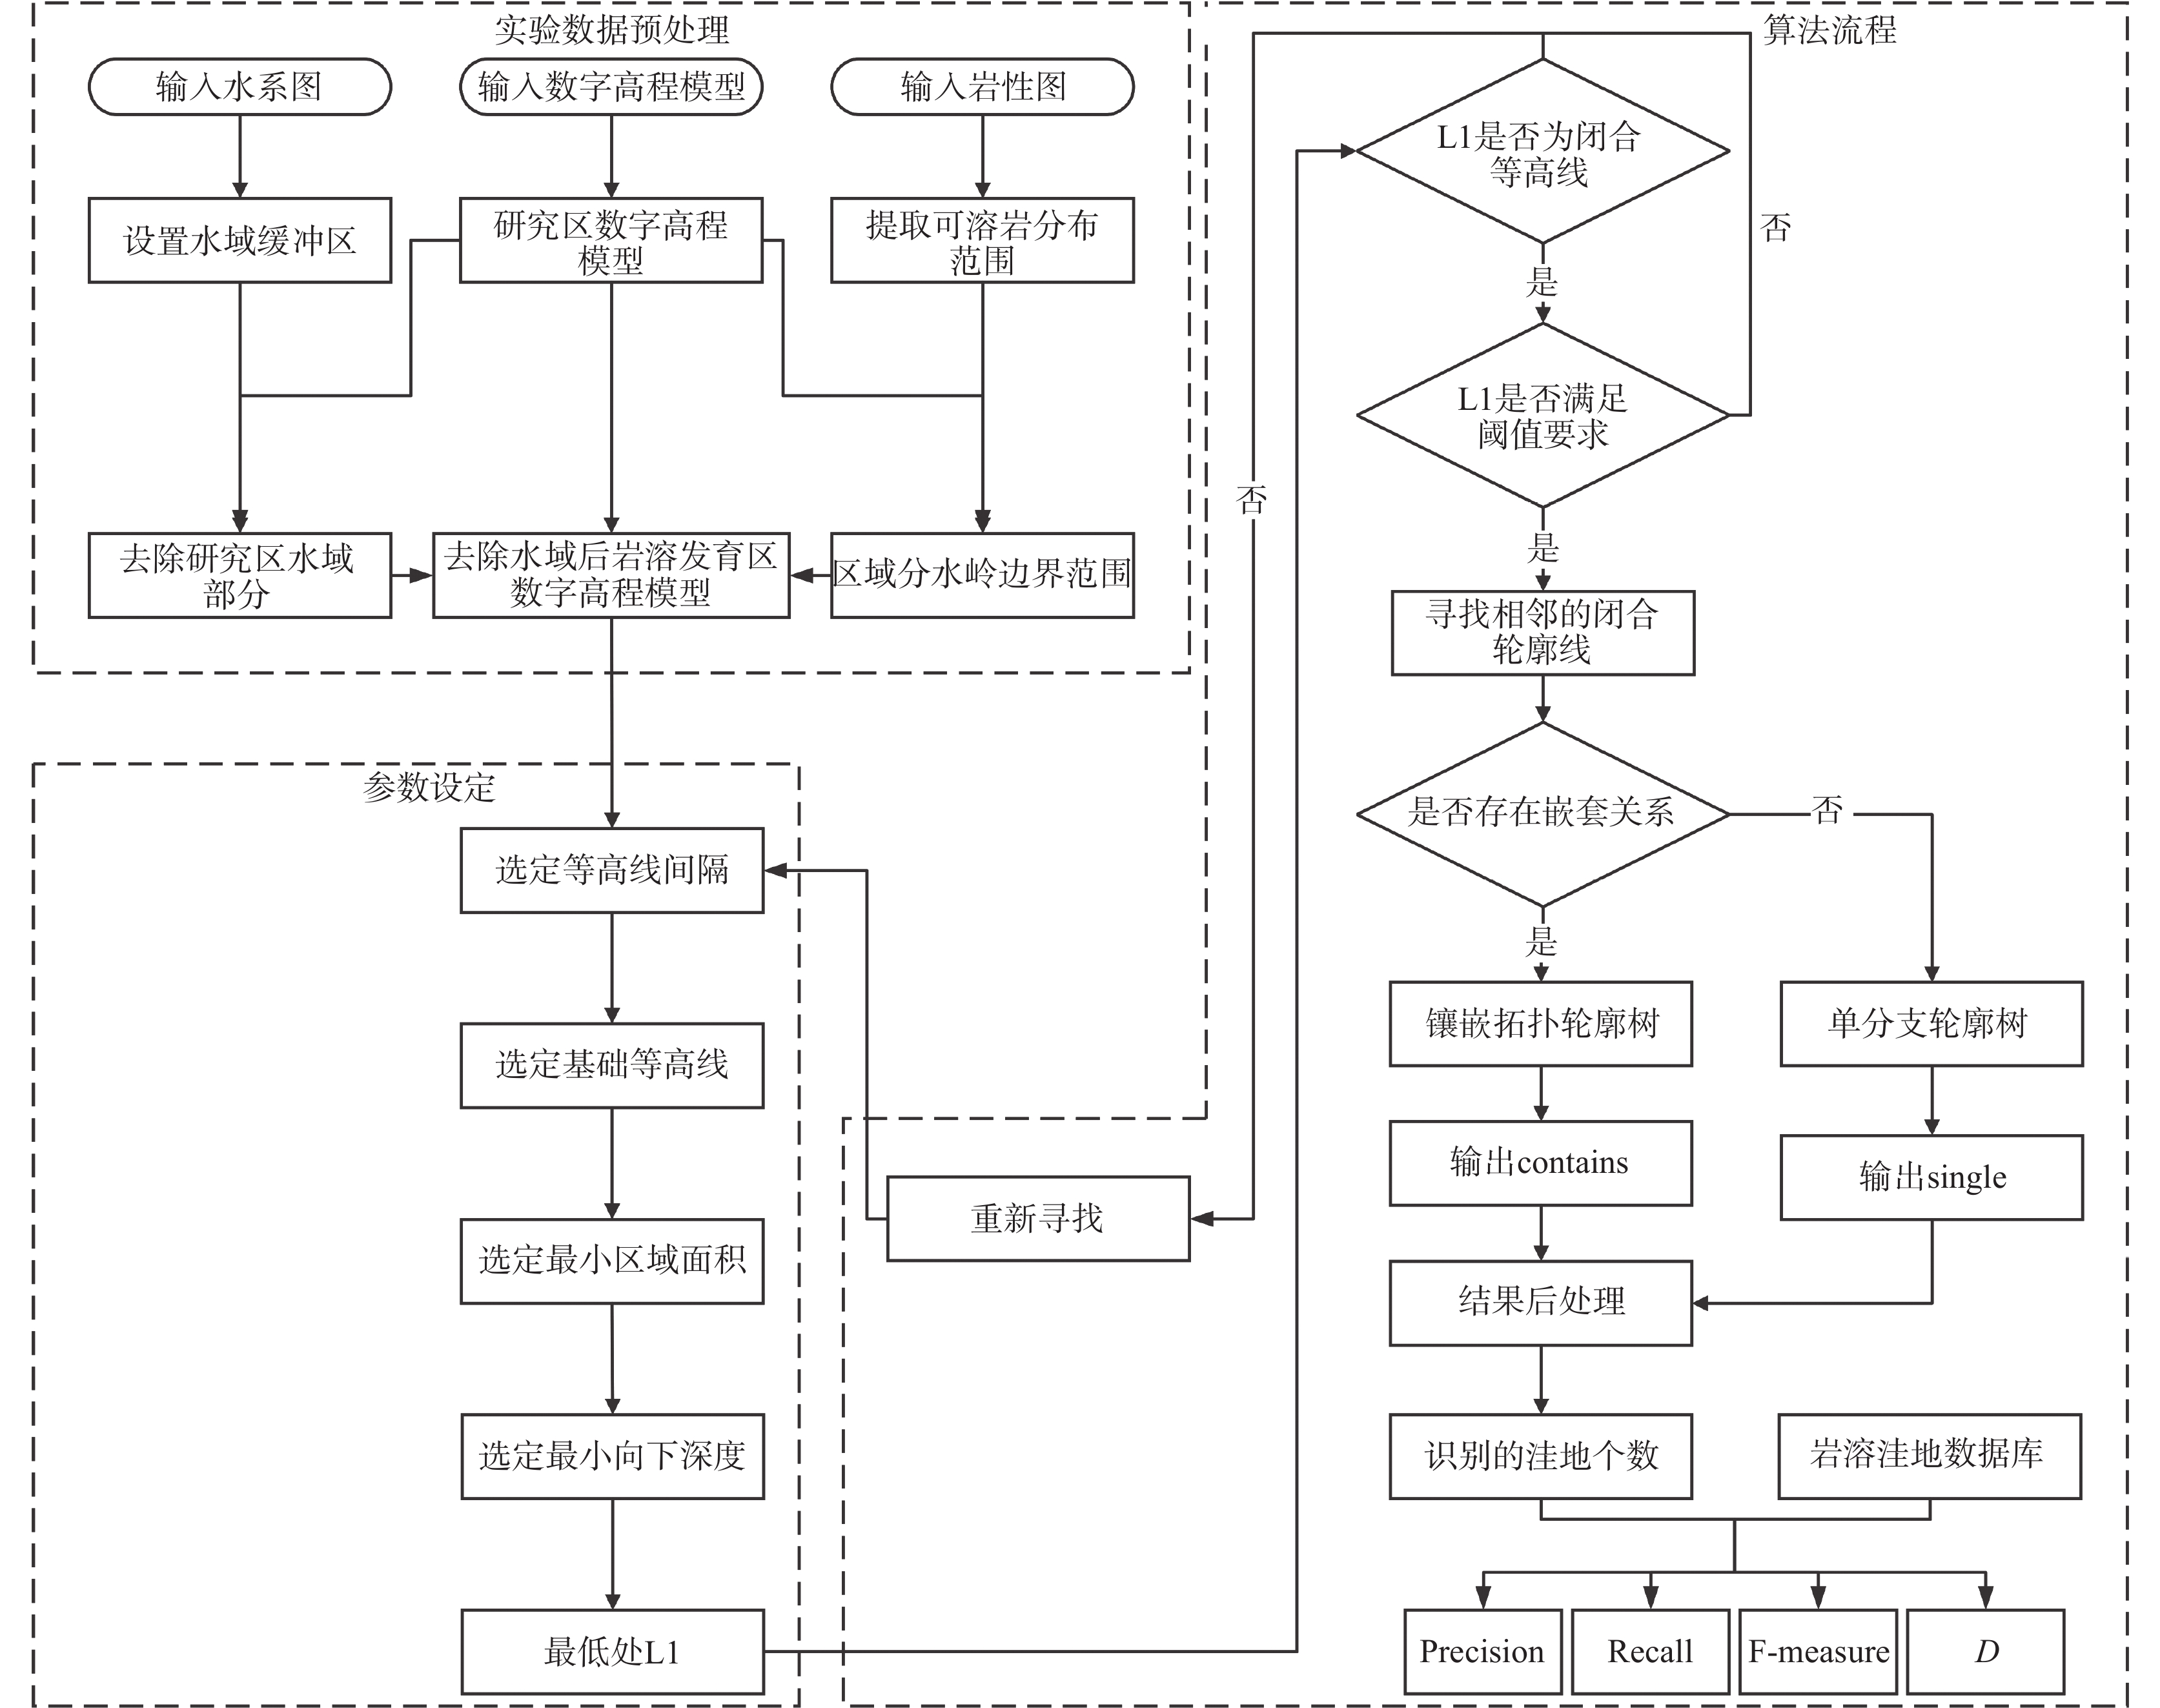
图 4 岩溶洼地形态特征和拓扑关系图
Figure 4. Diagram for morphological characteristics and topological relationship of karst depressions
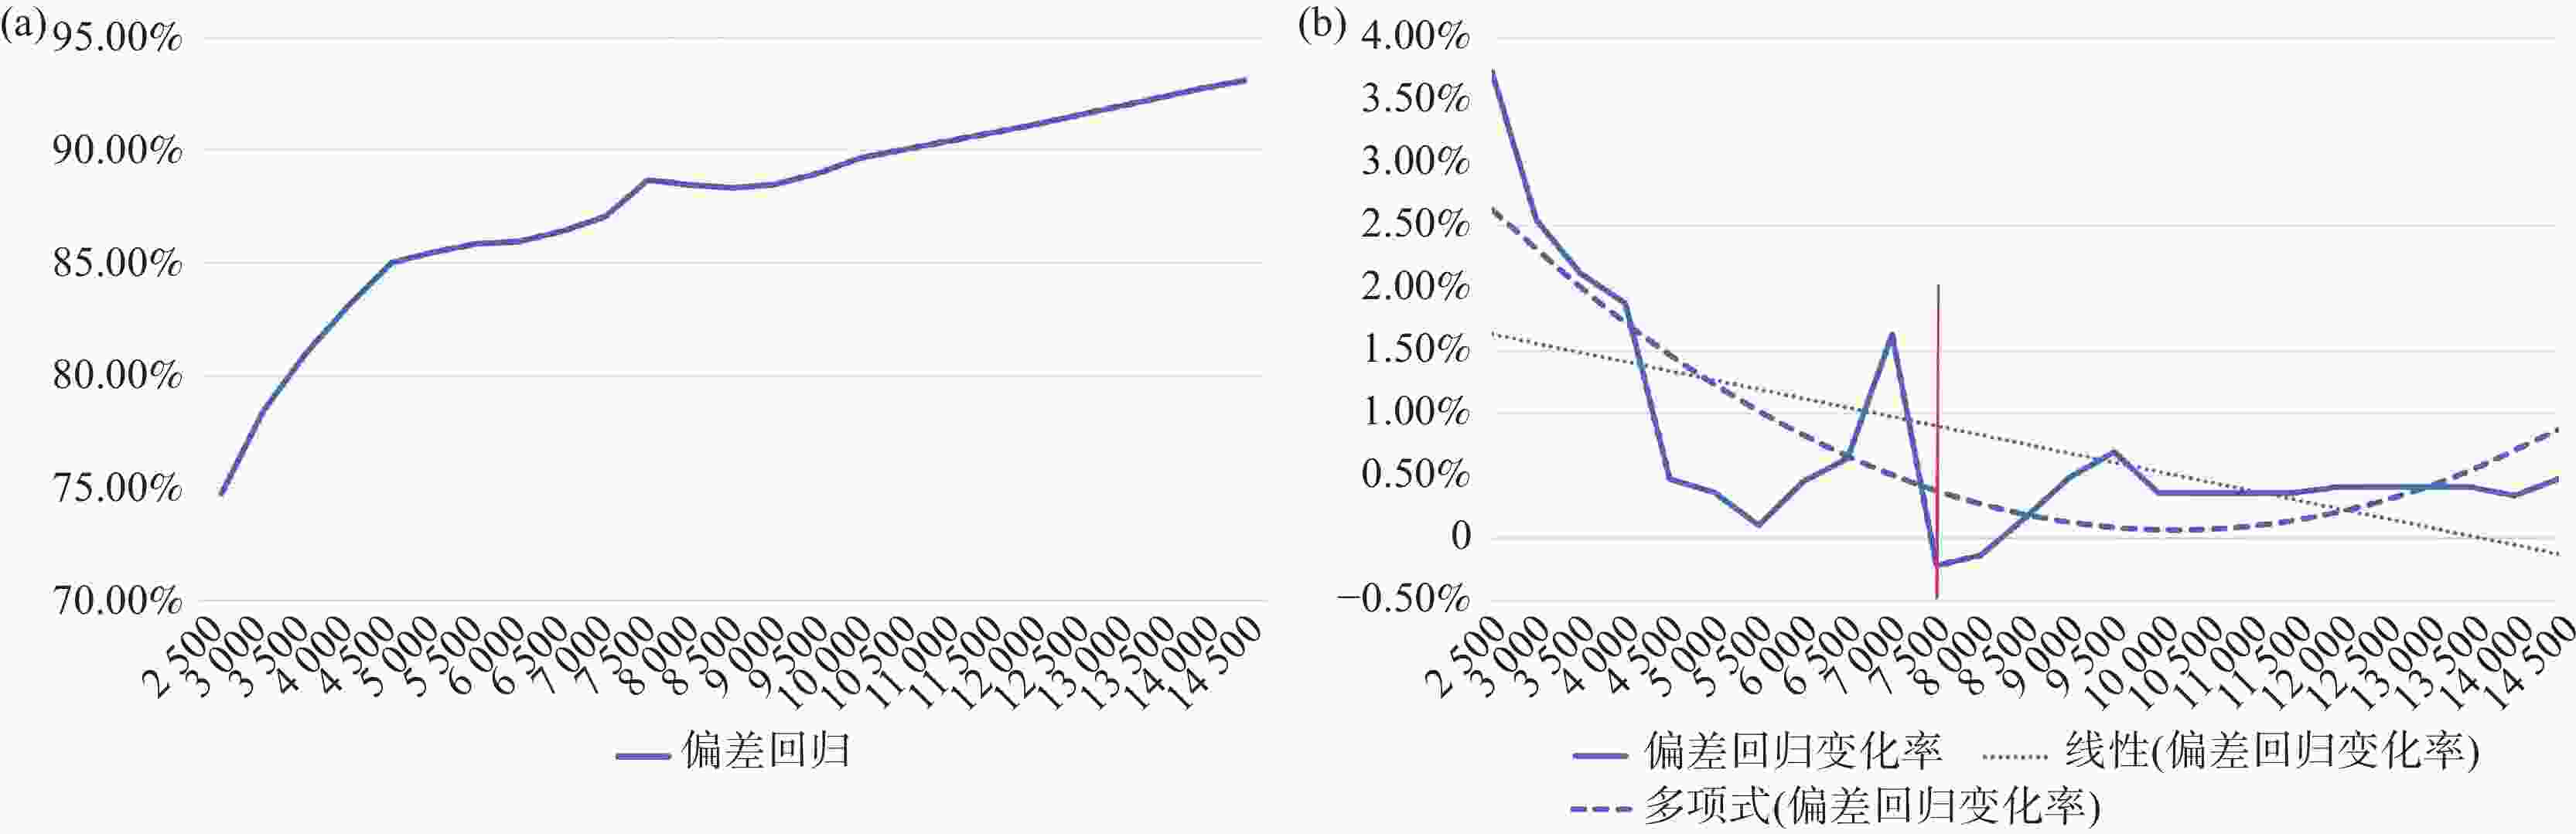
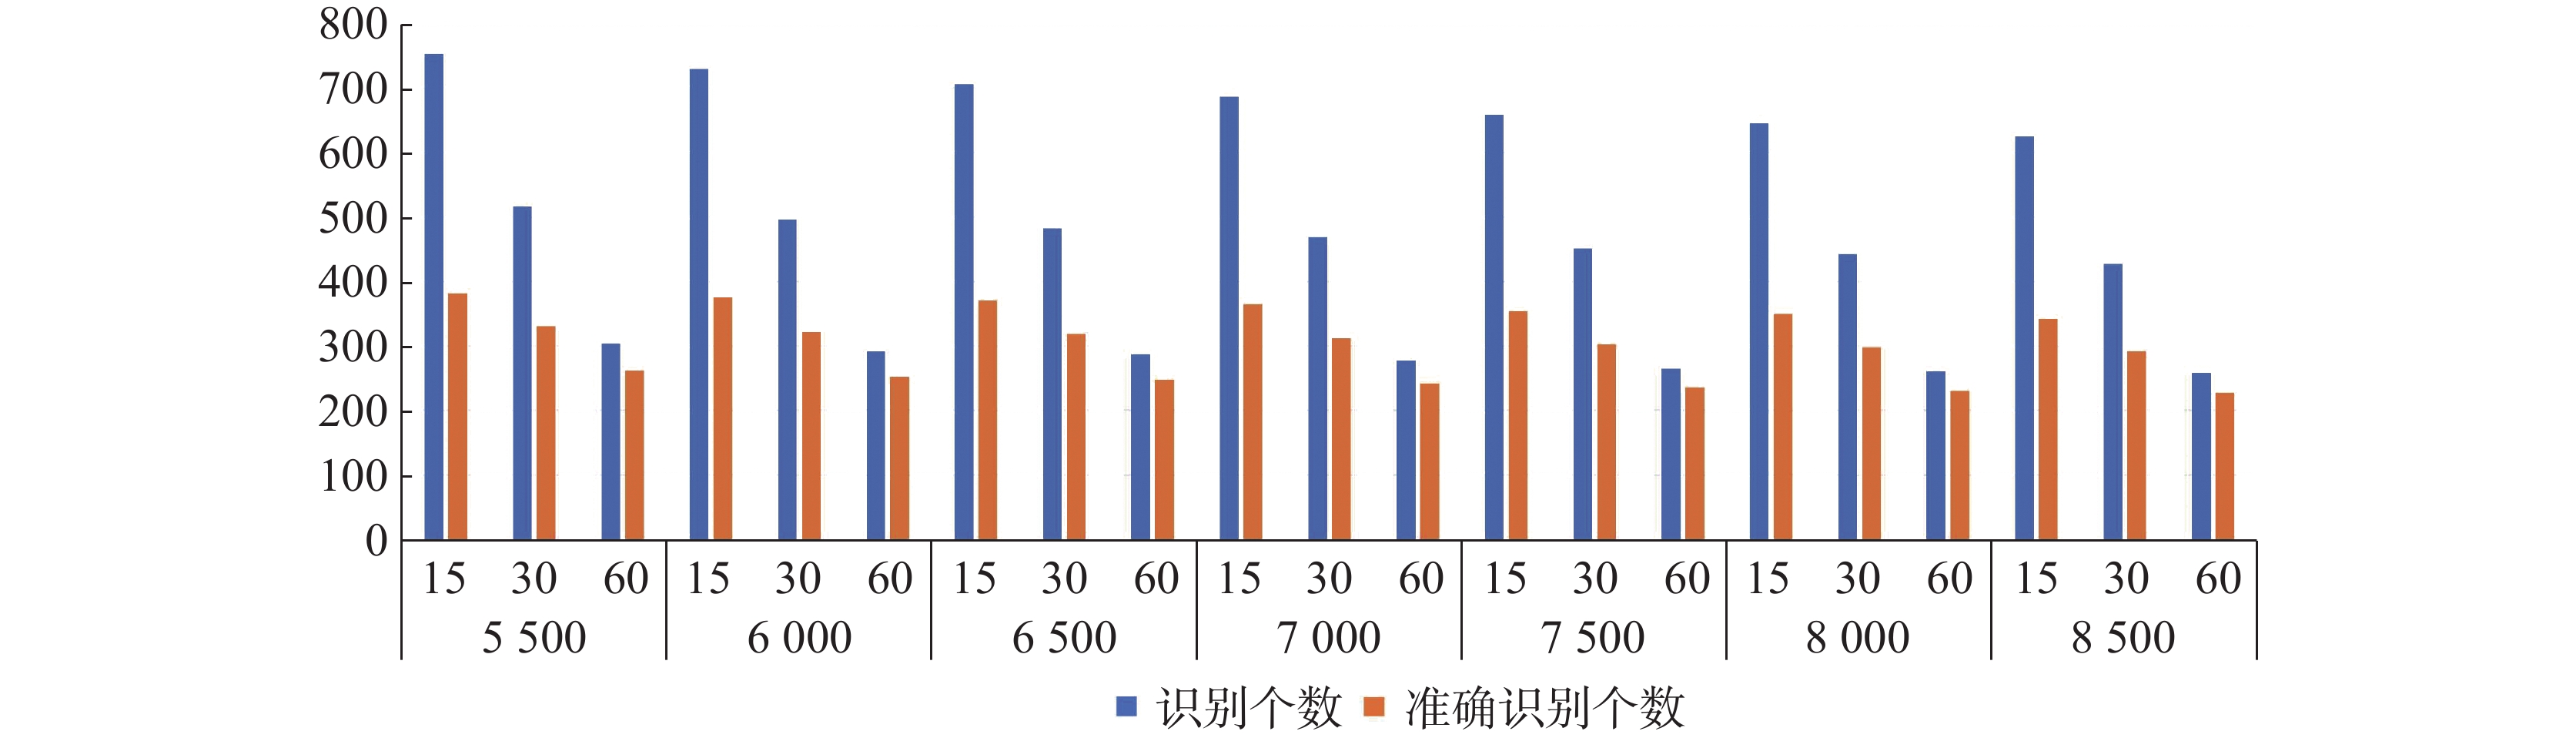
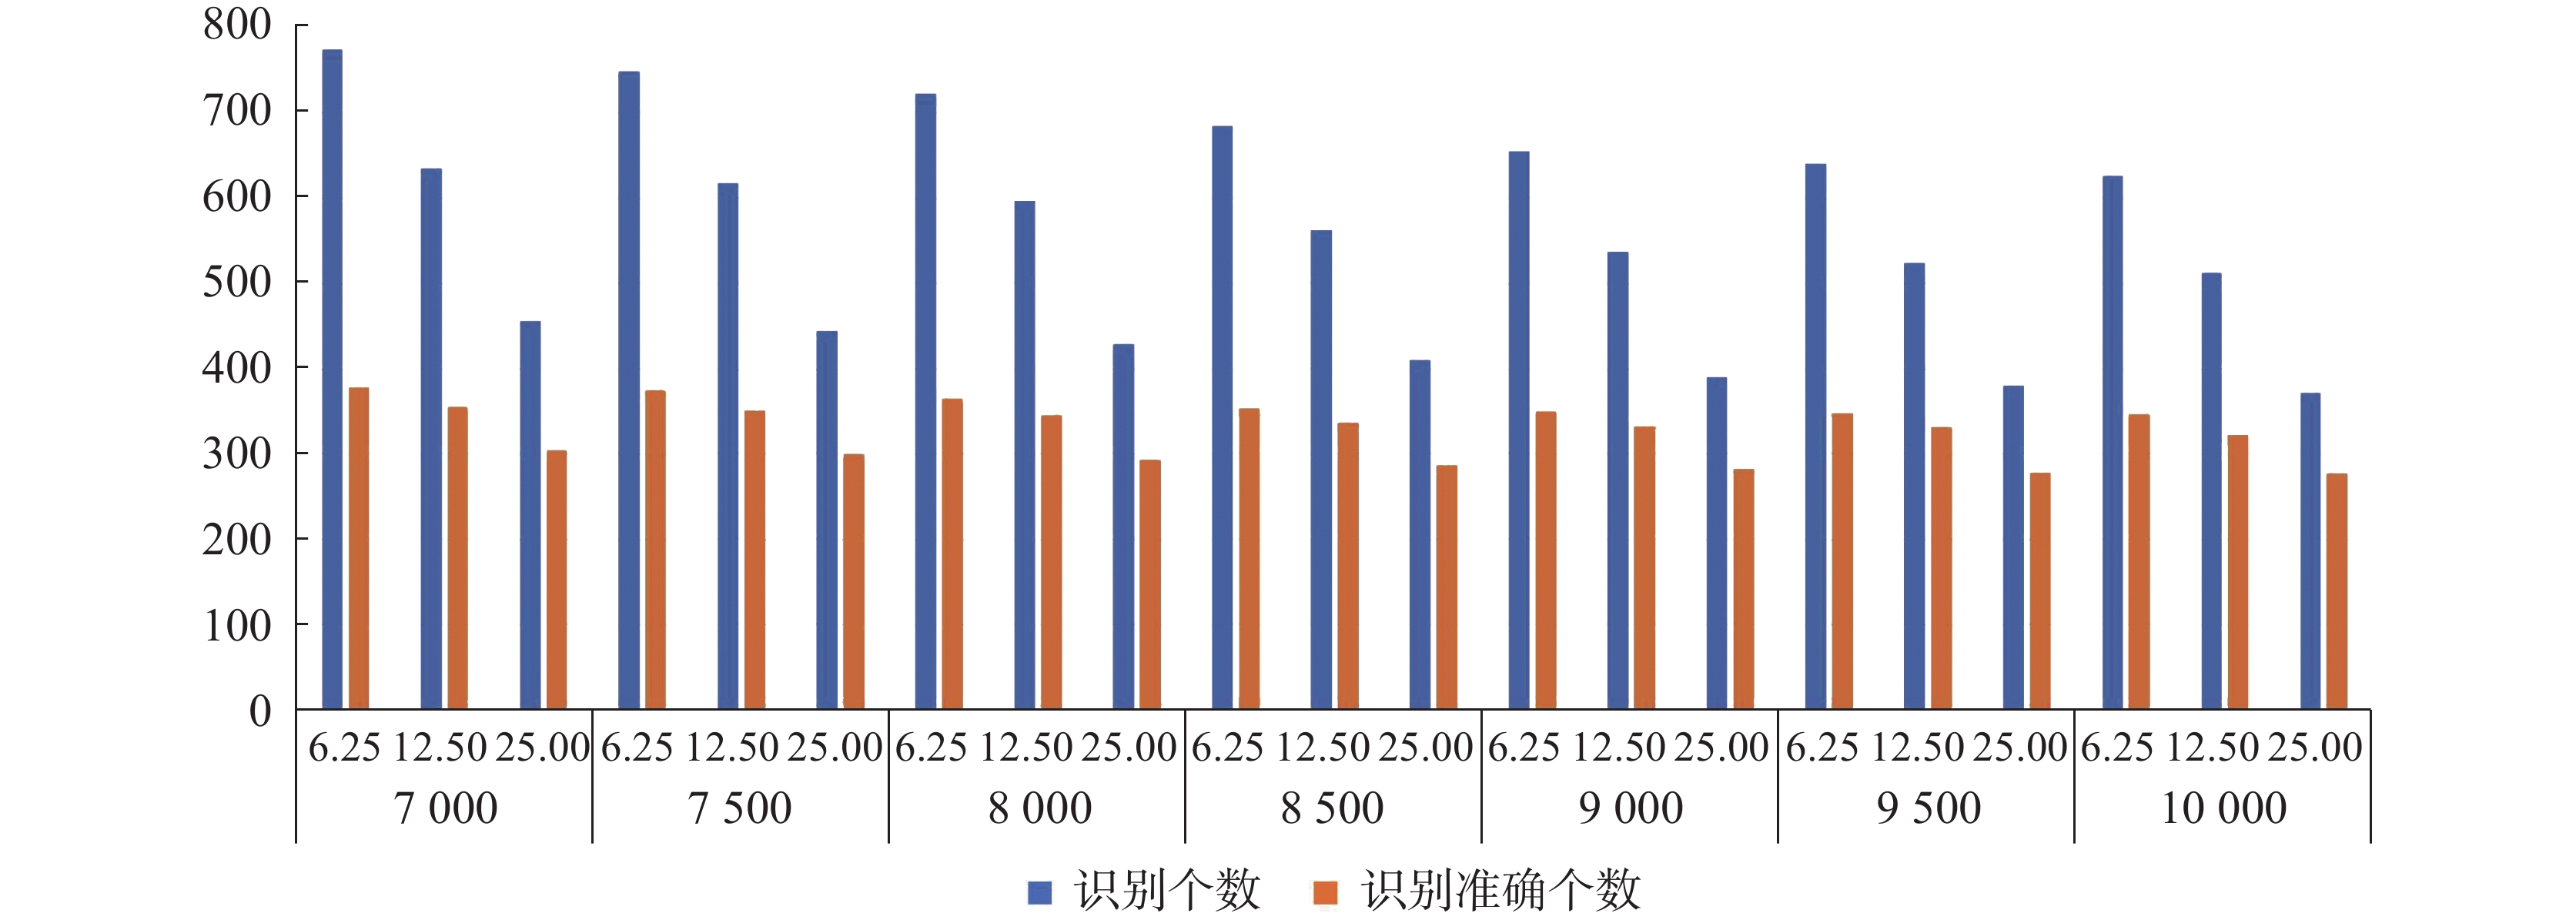
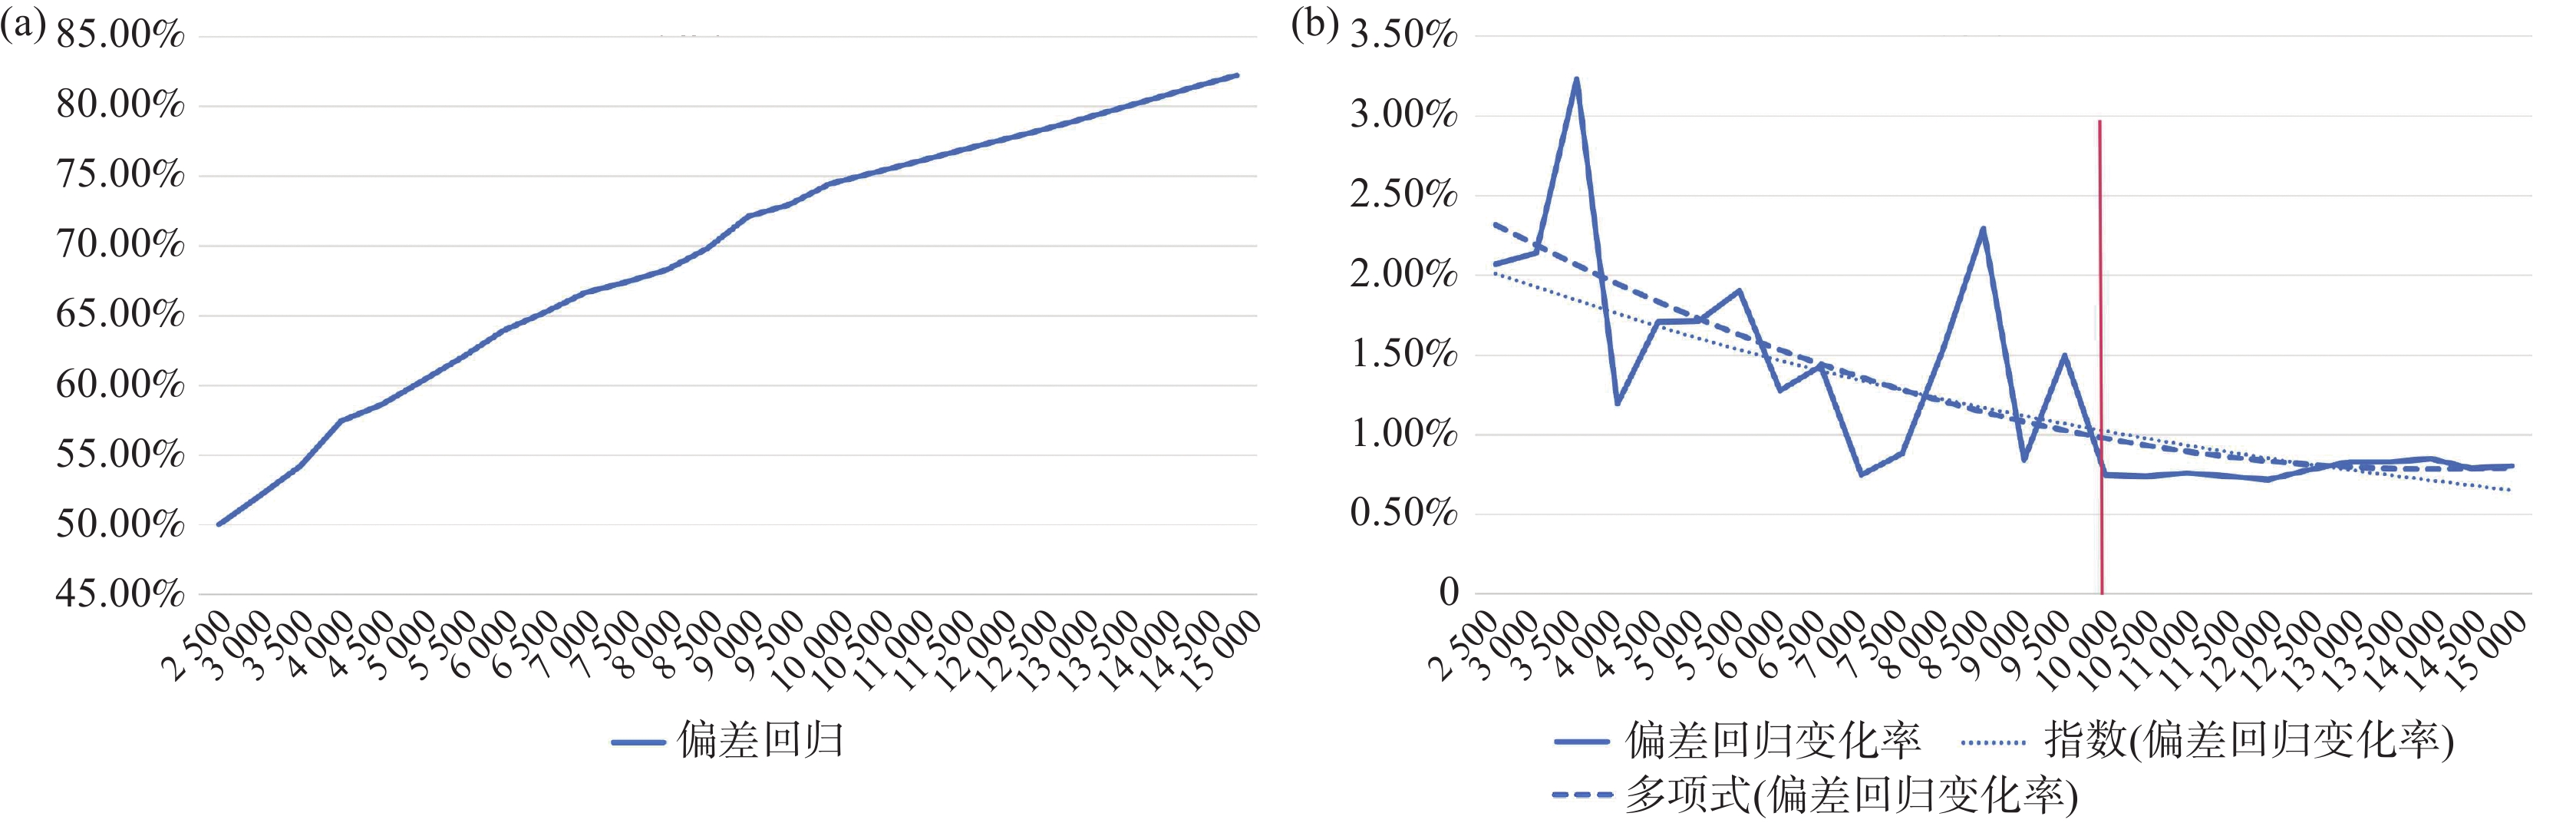
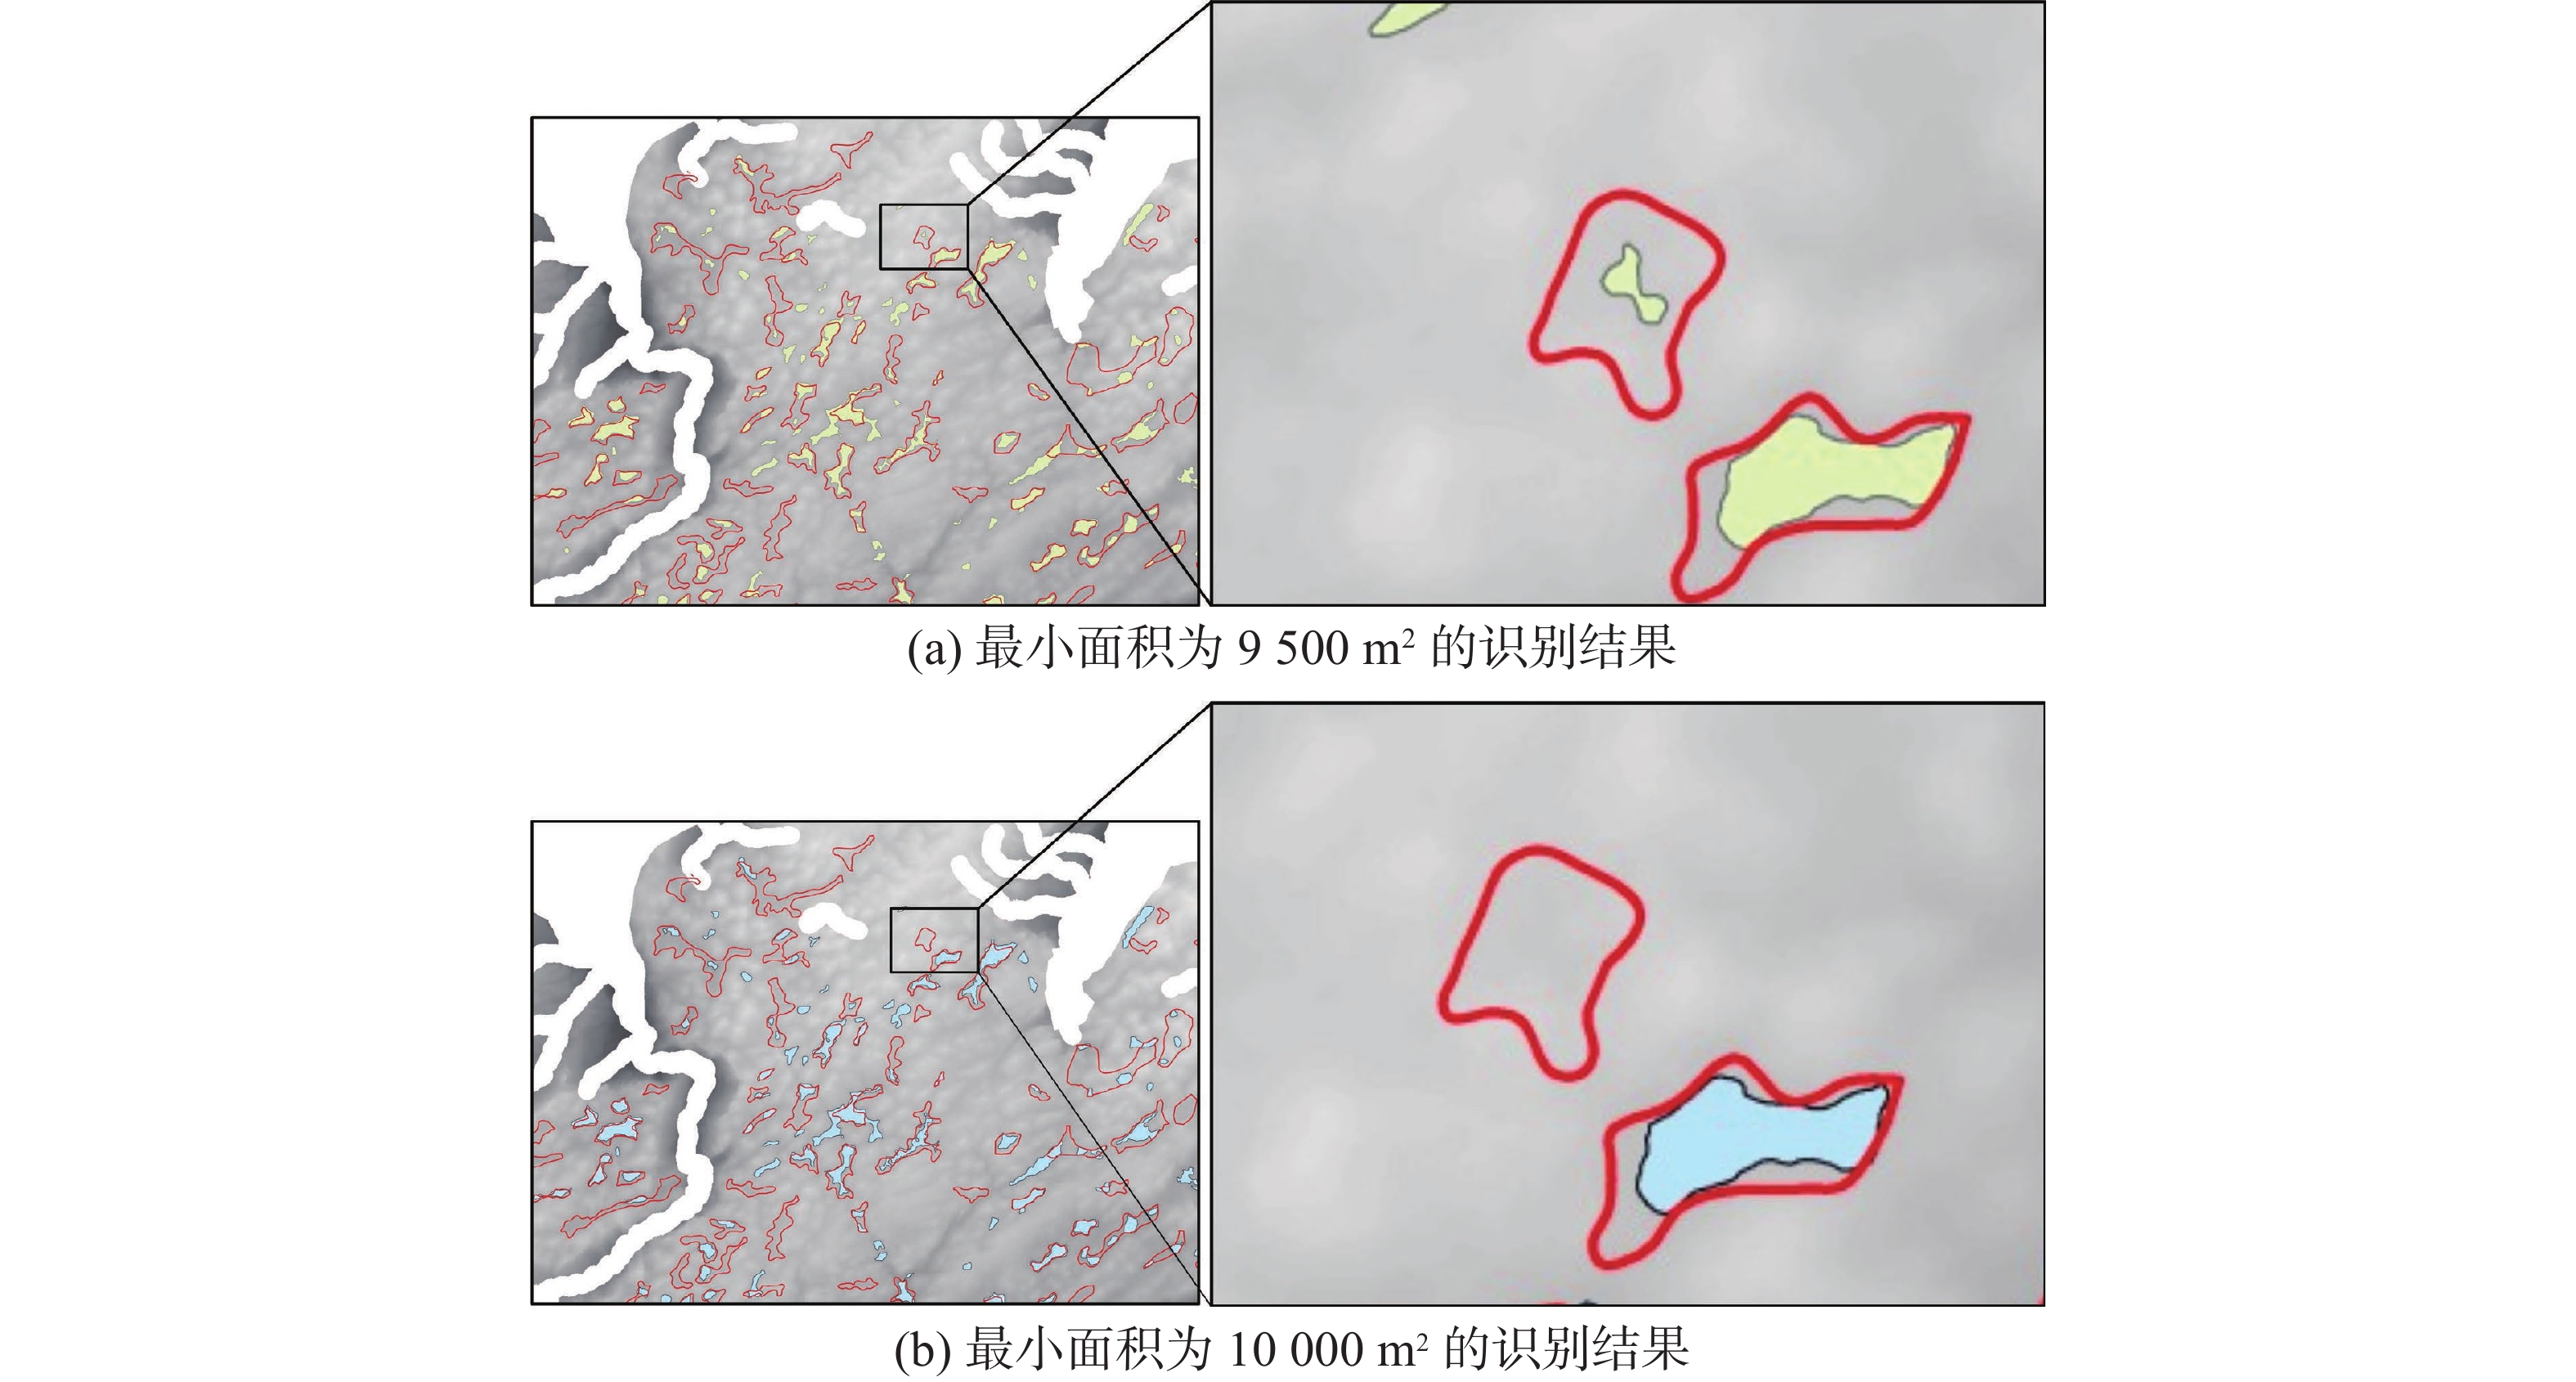
图 10 等高线间隔固定时最小面积变化的偏差回归值变化情况
Figure 10. Variations in the regression value of the deviation of the minimum area change when the contour interval is fixed
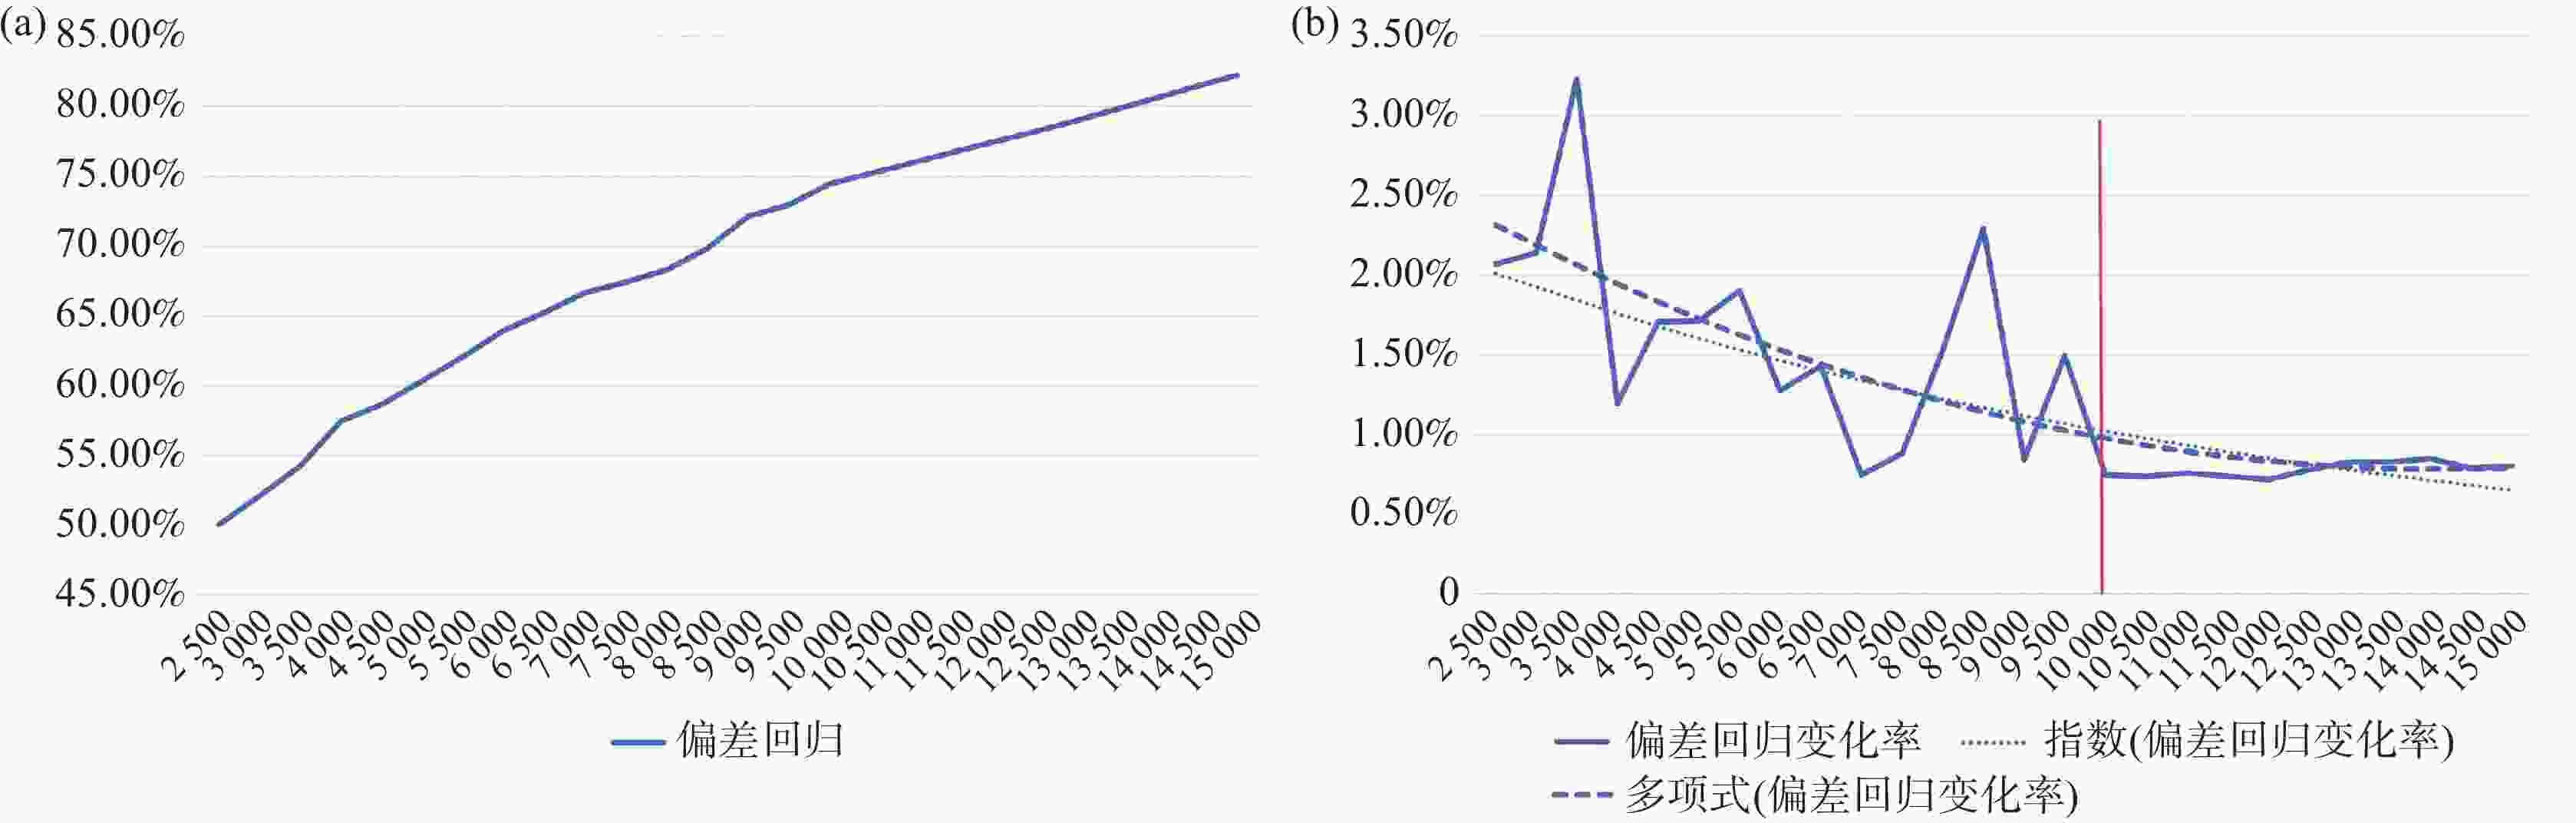
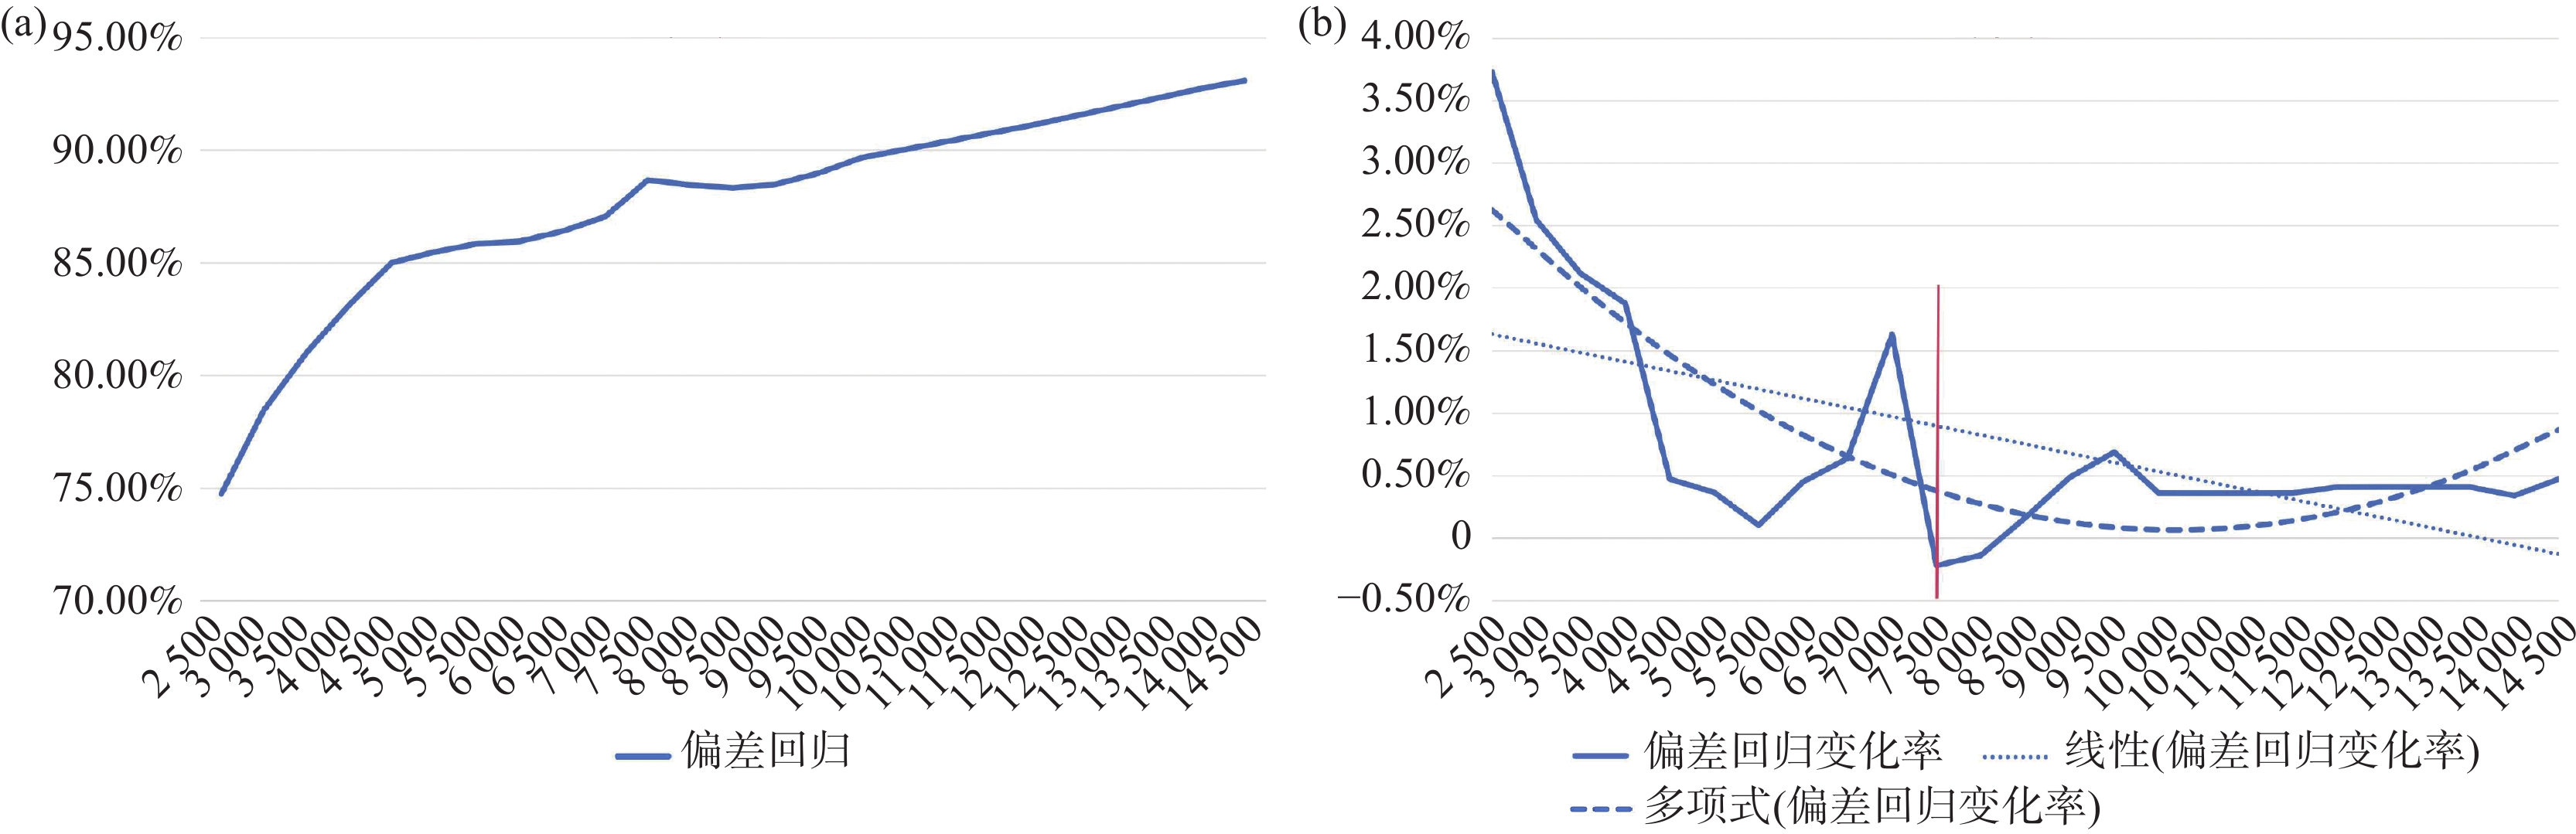
图 14 等高线间隔固定时最小面积变化的偏差回归值变化情况
Figure 14. Variations in the regression value of the deviation of the minimum area change when the contour interval is fixed
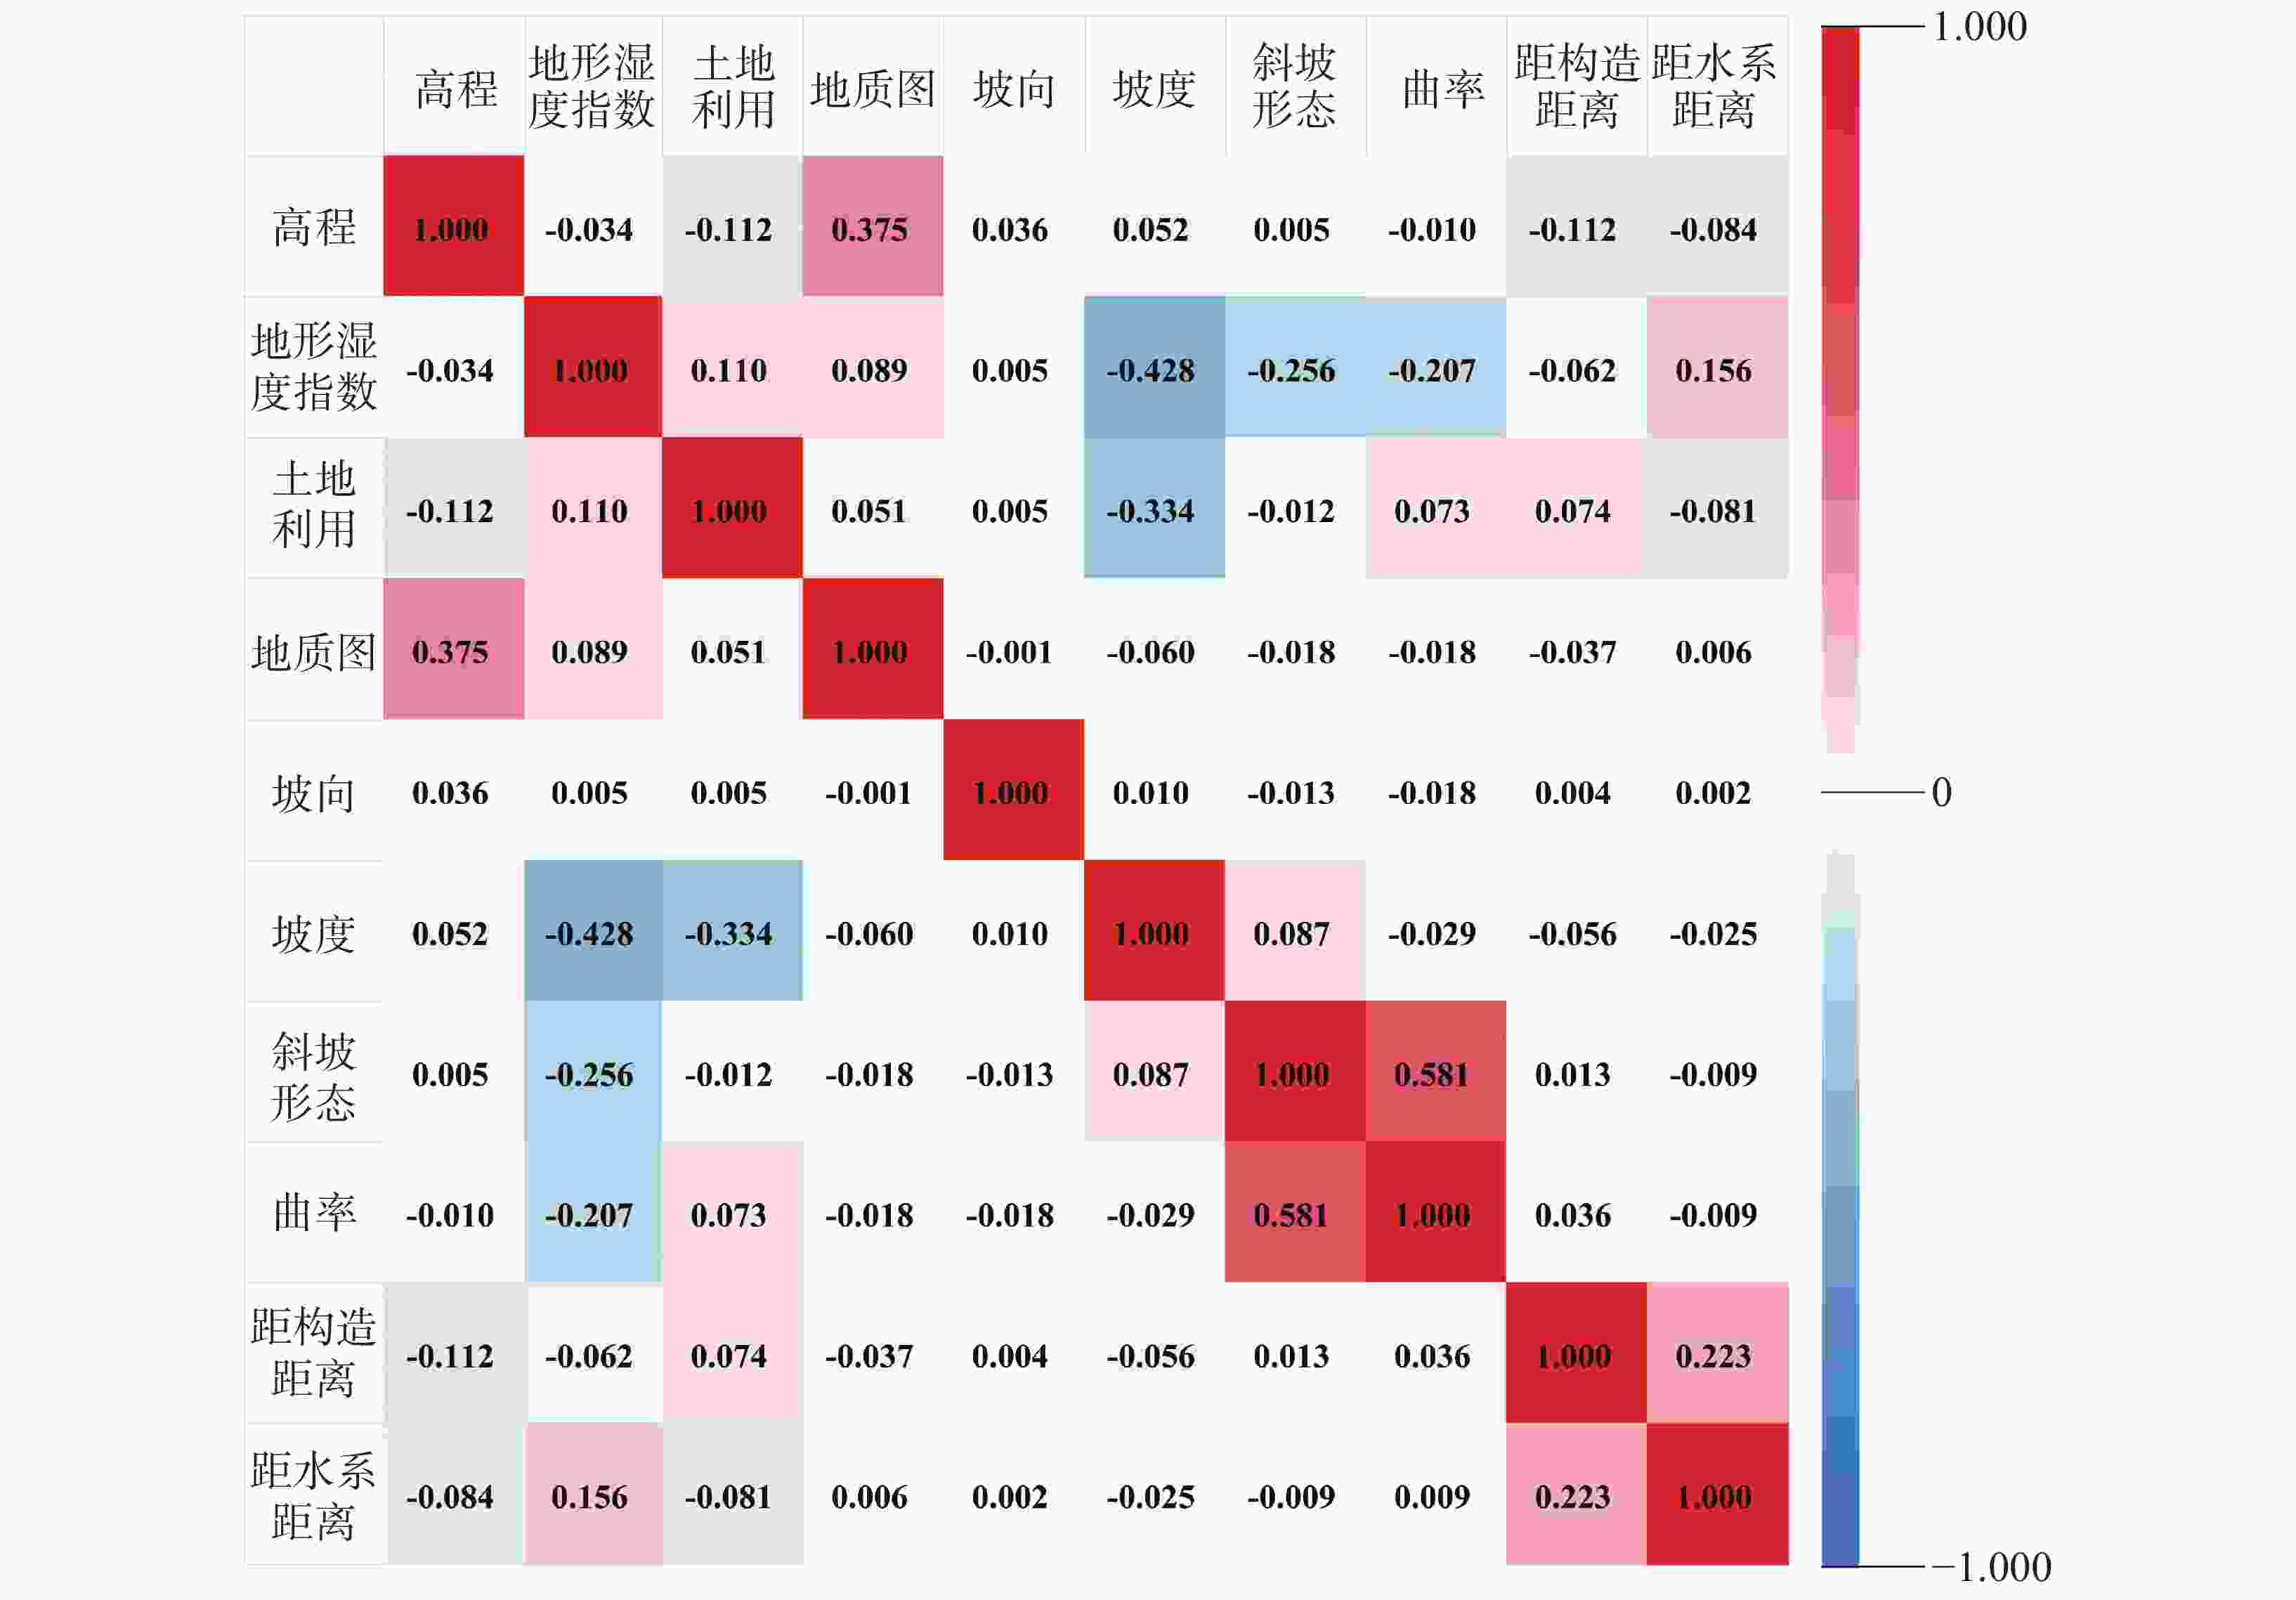
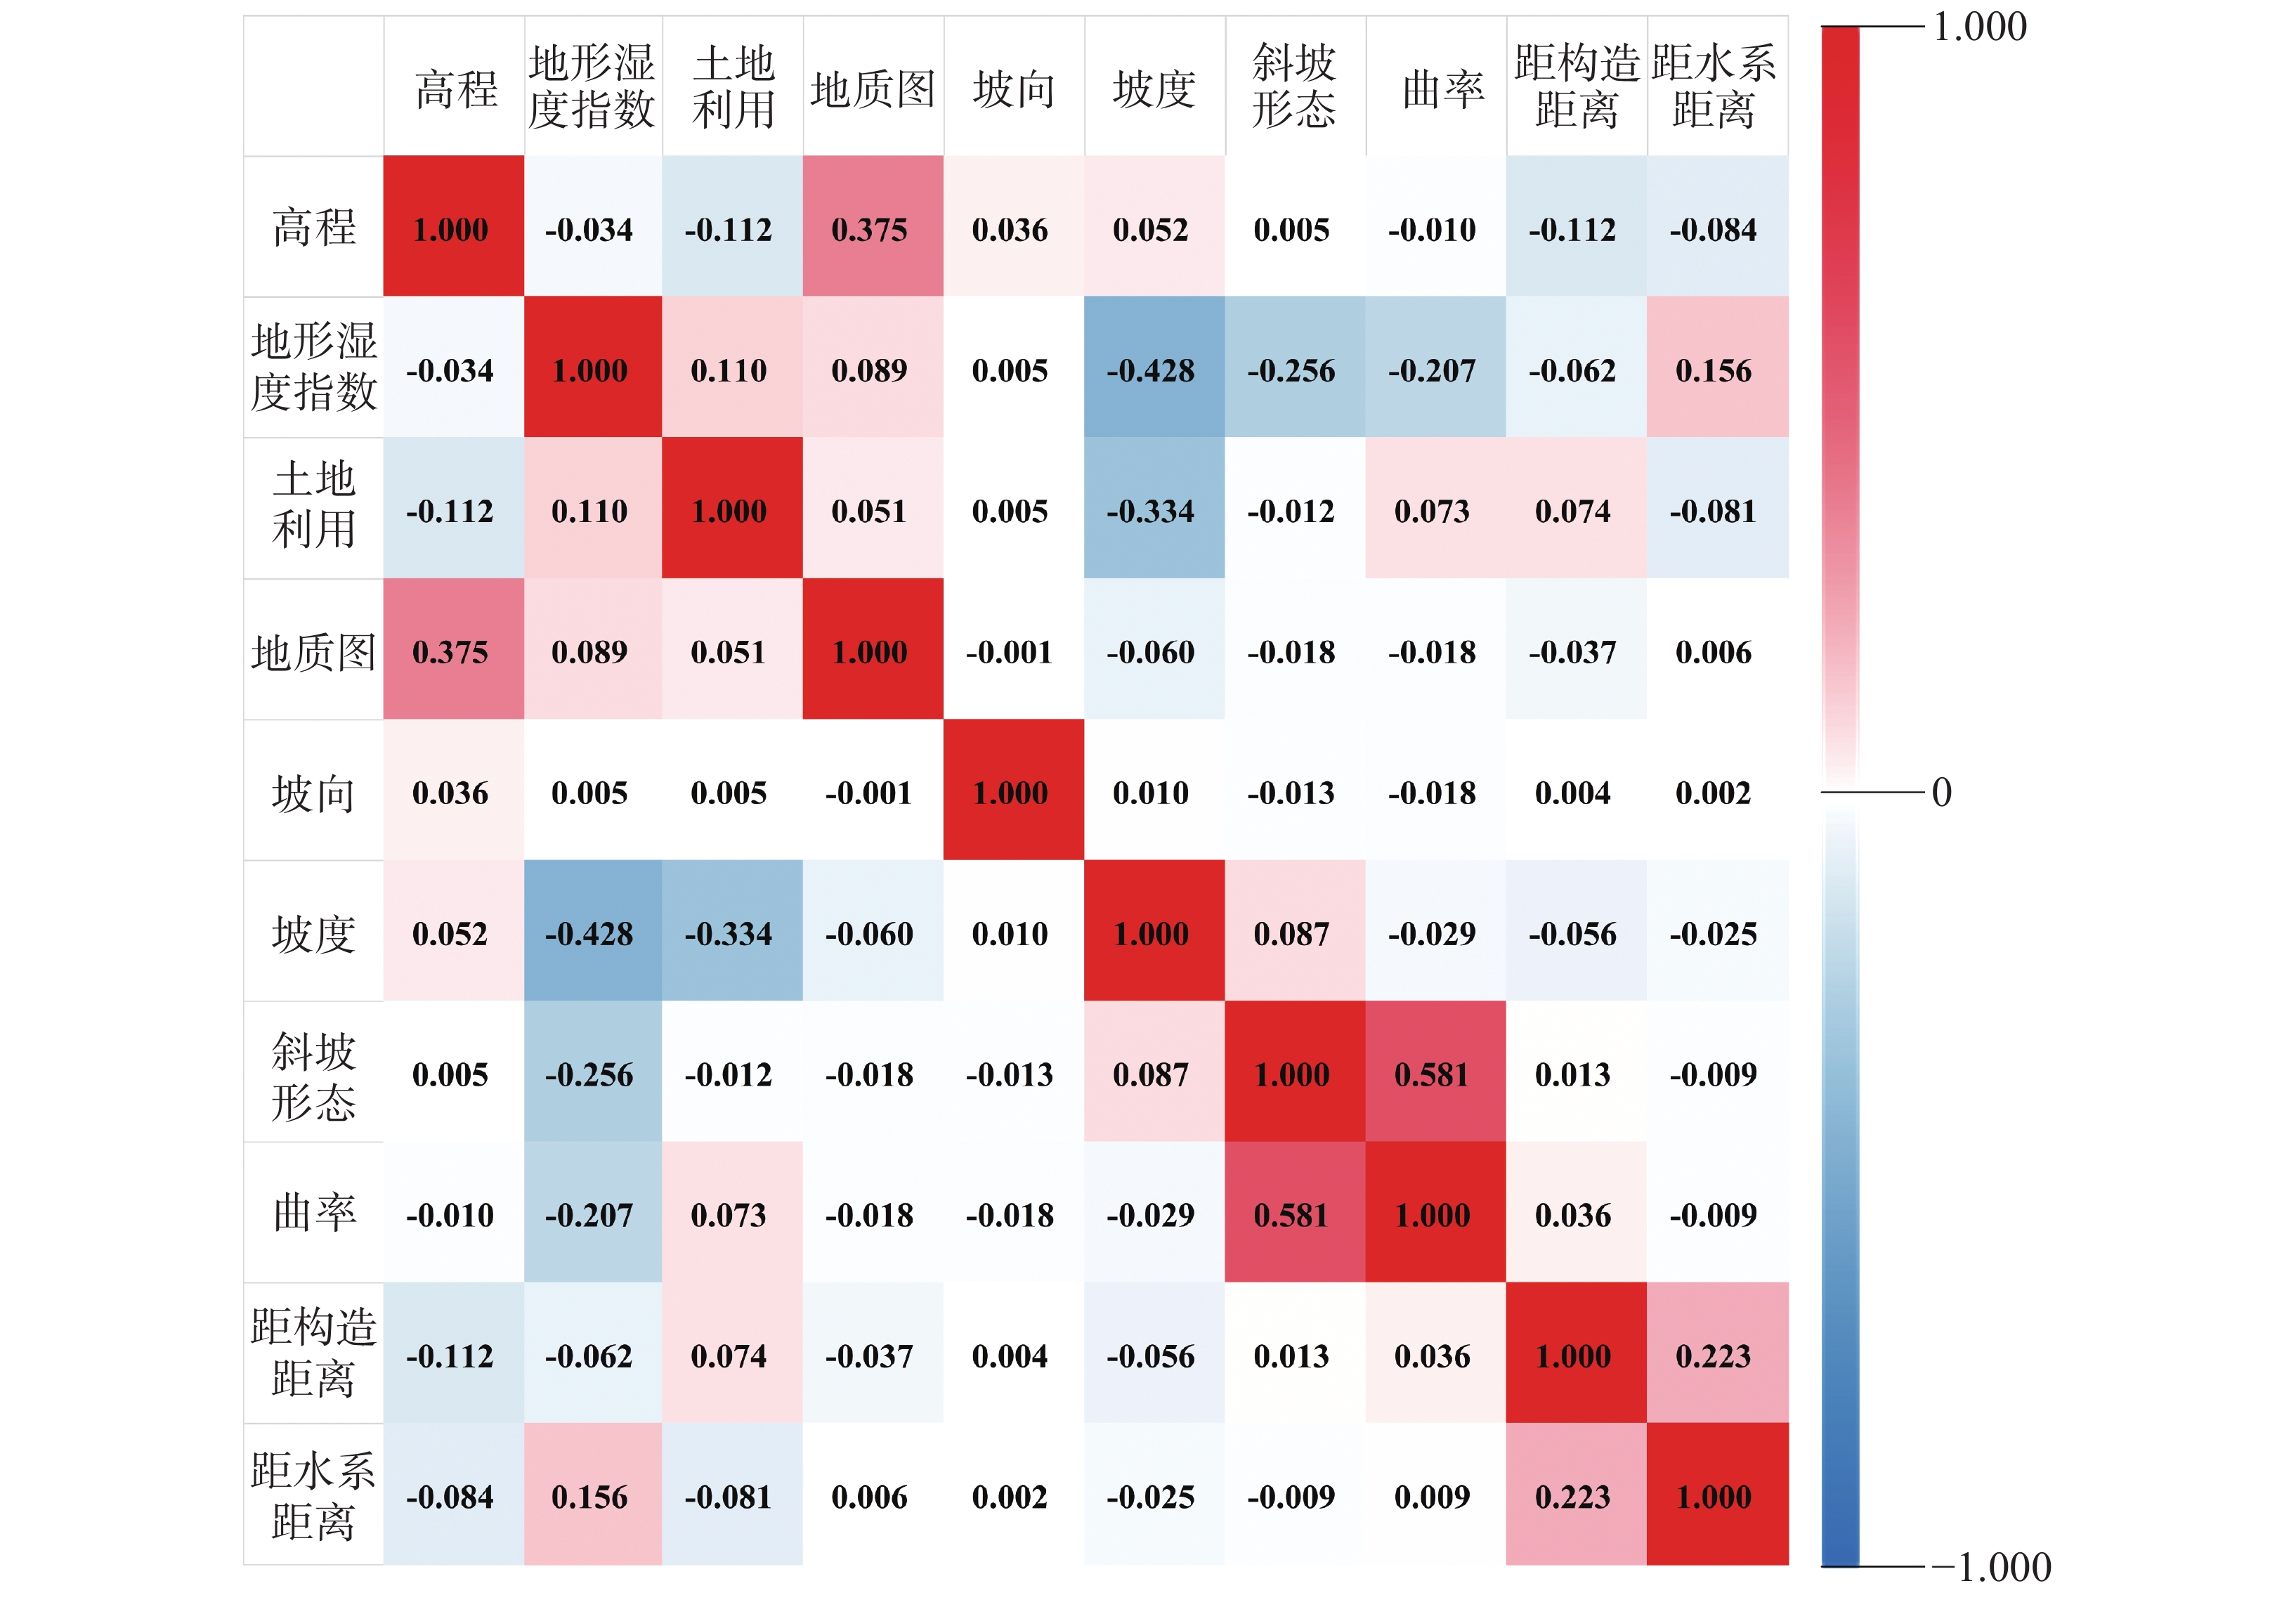
图 18 易发性评价因子的皮尔逊相关系数
Figure 18. Pearson correlation coefficient of susceptibility evaluation factors
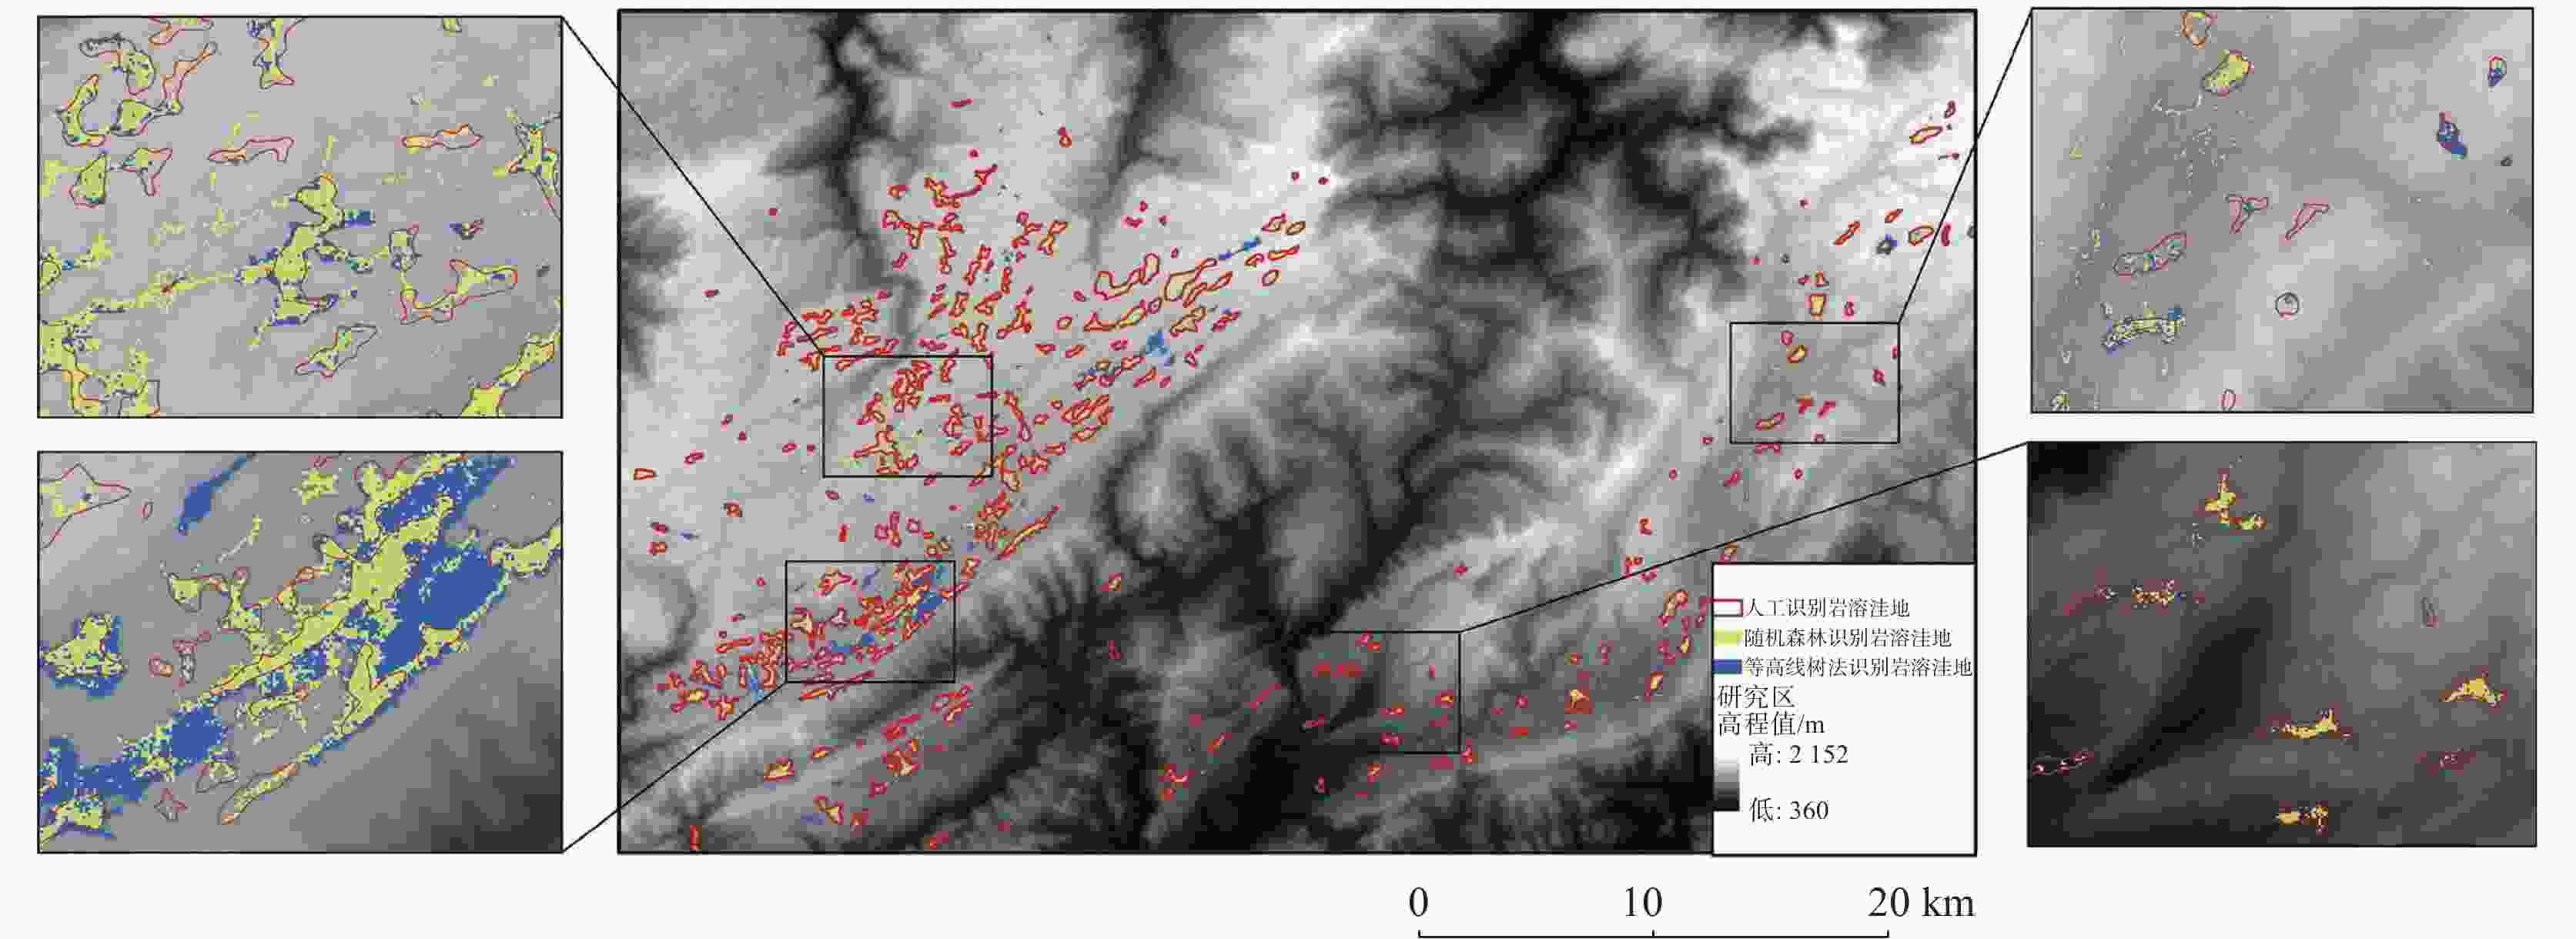
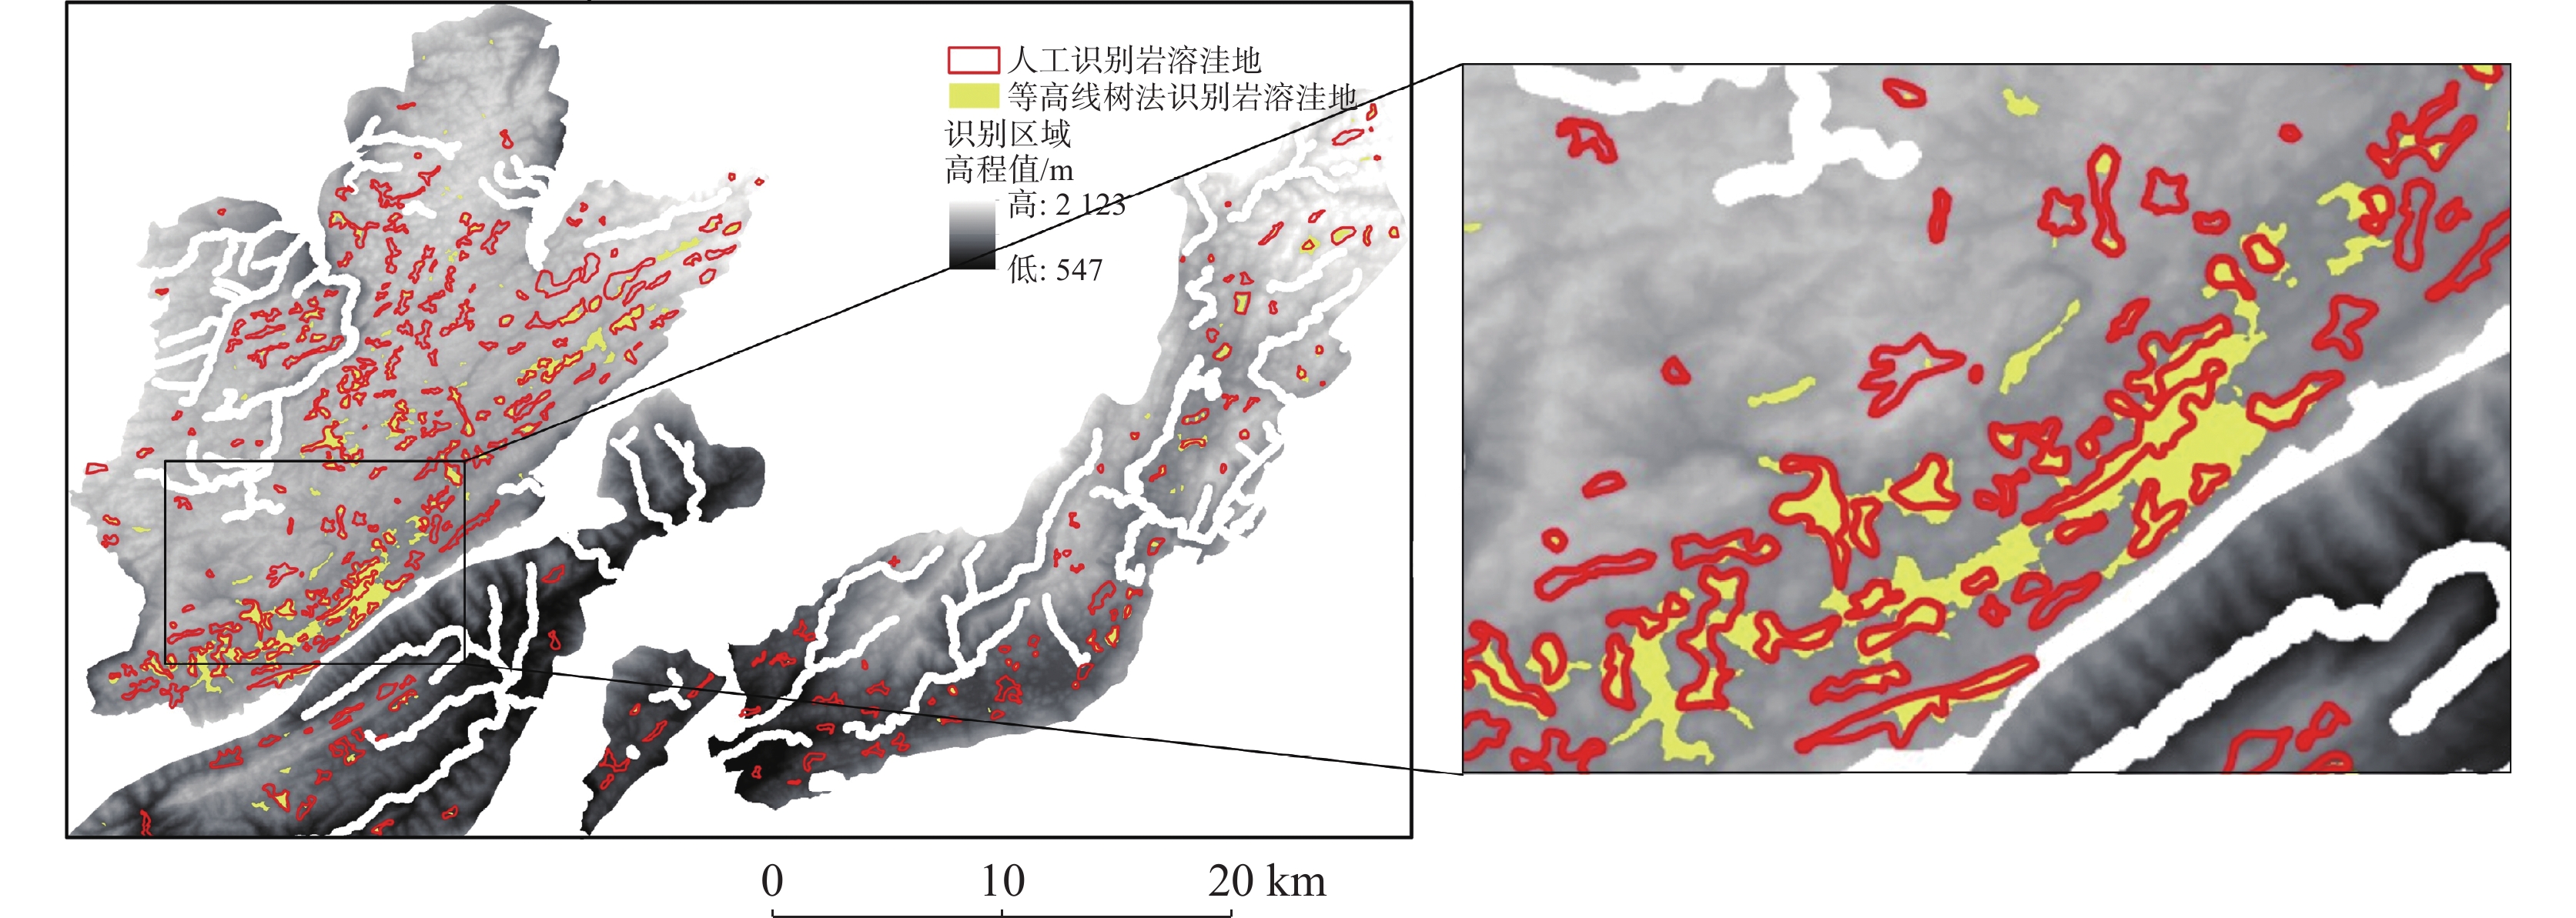
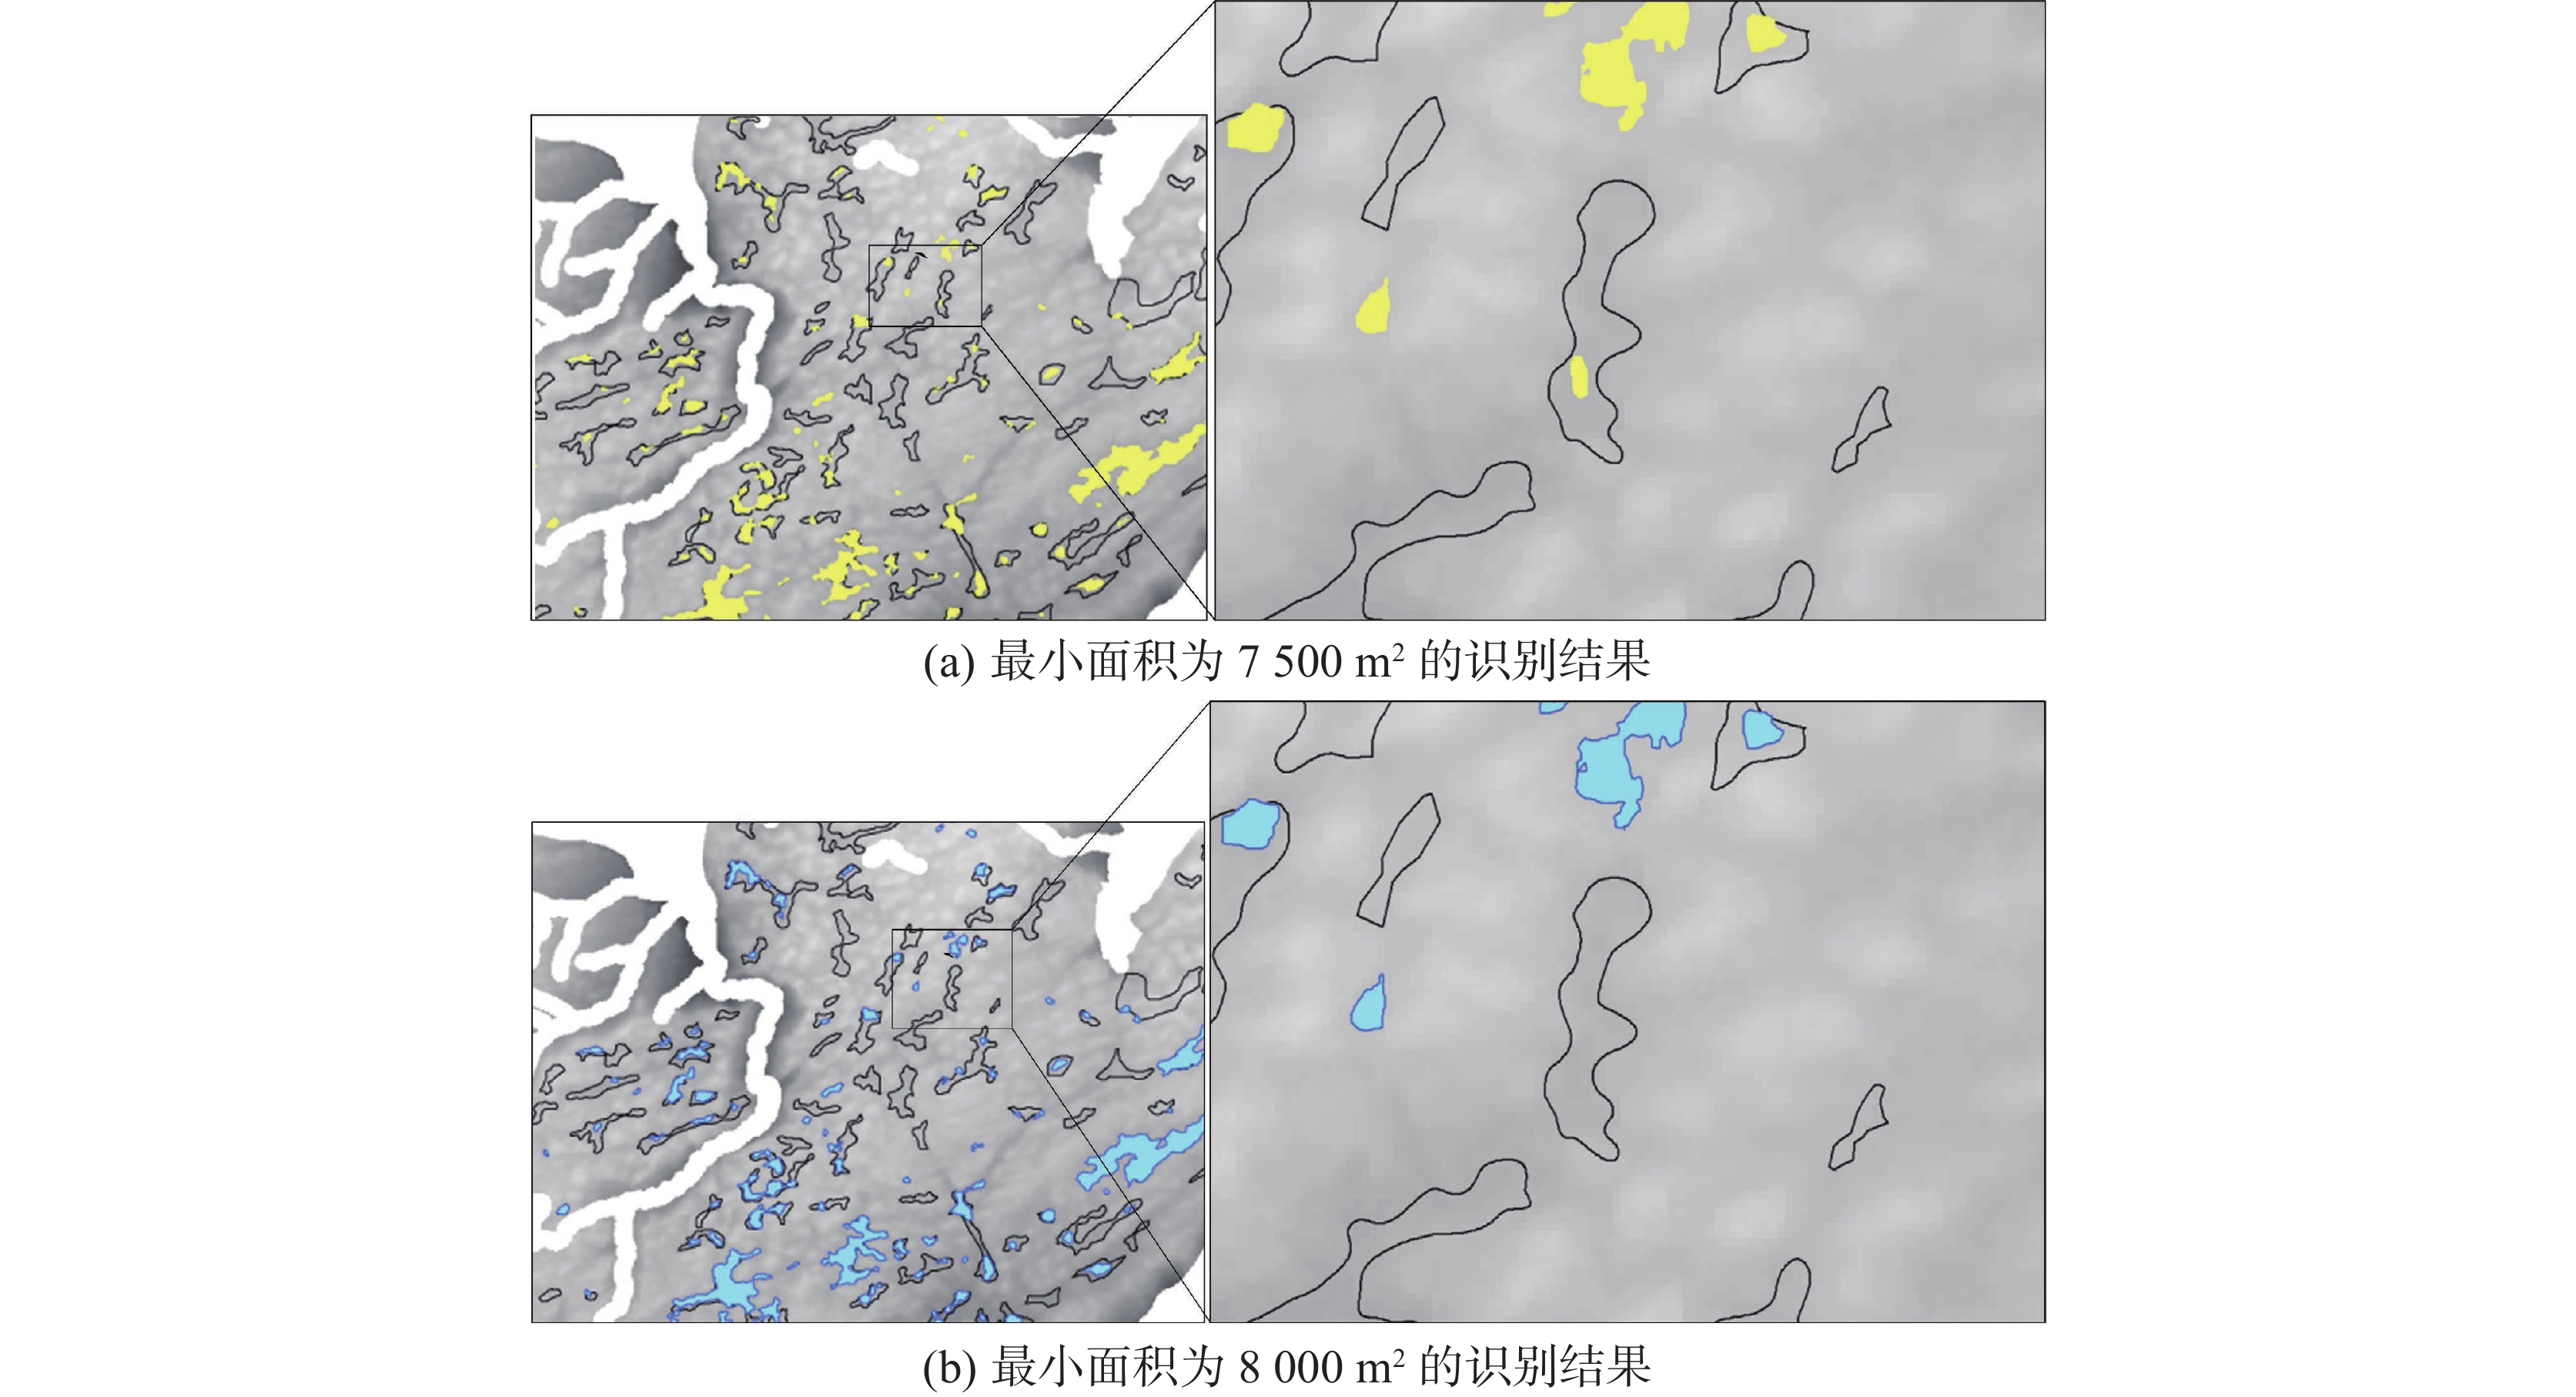
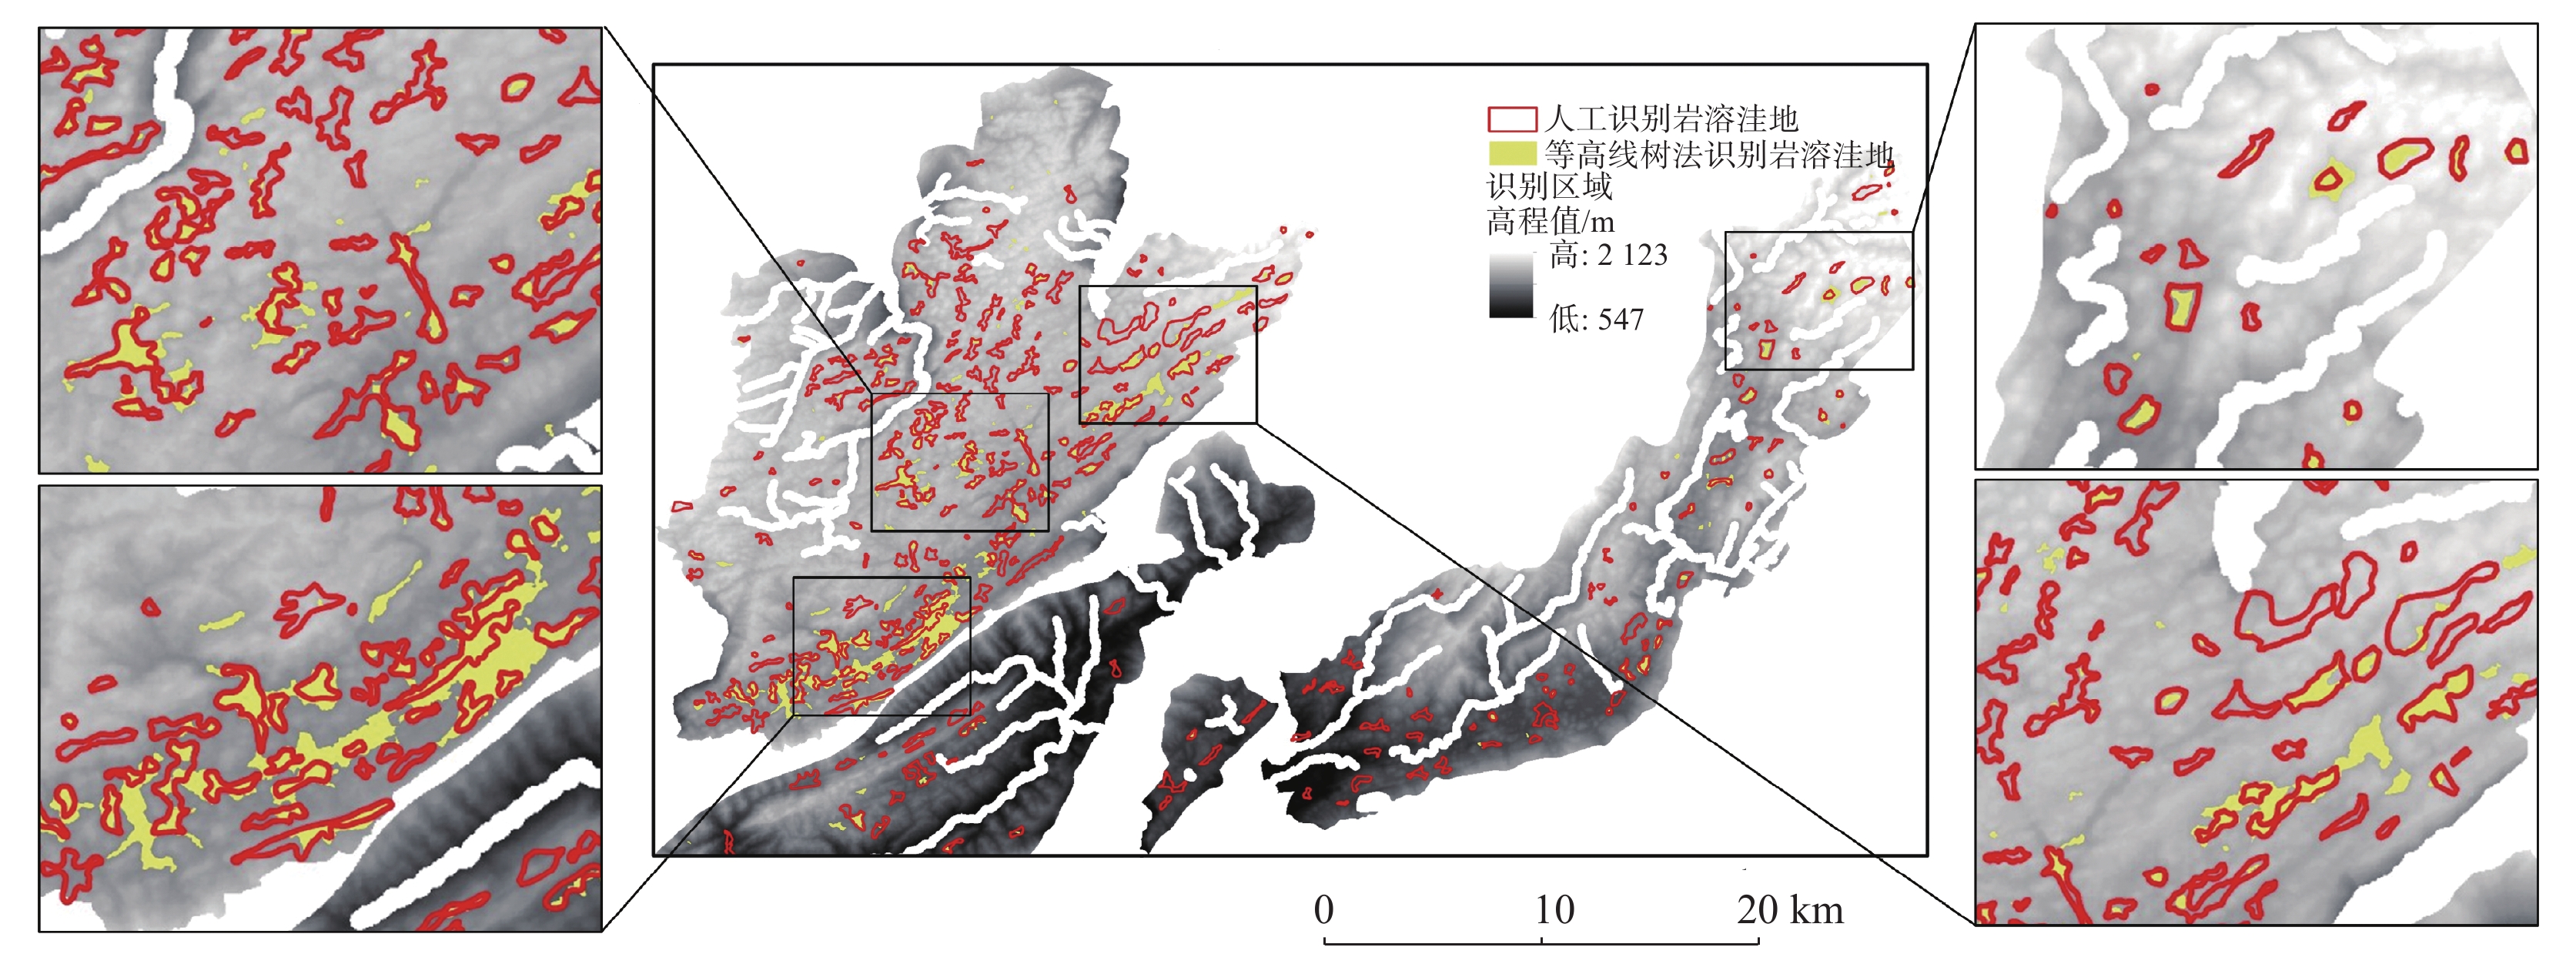
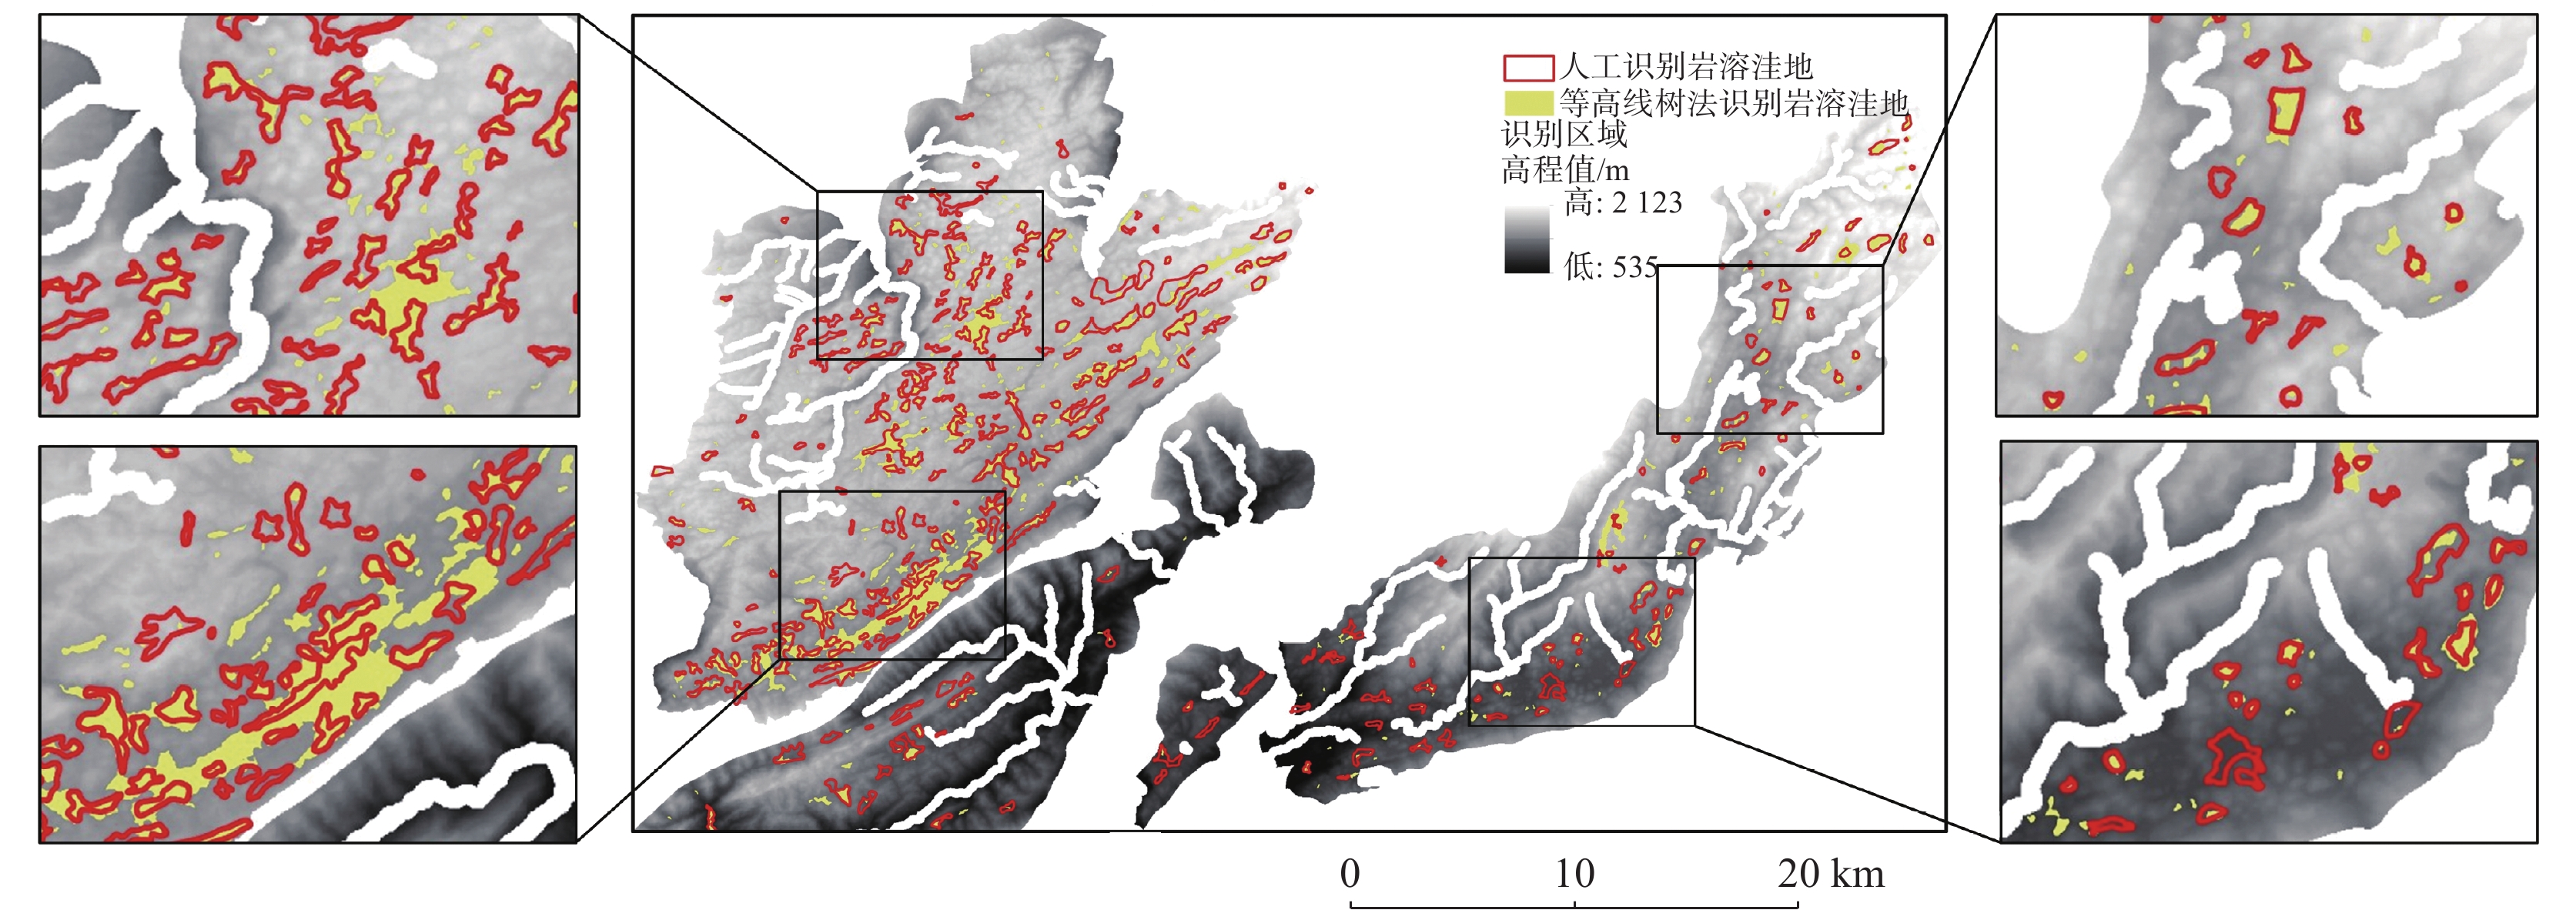
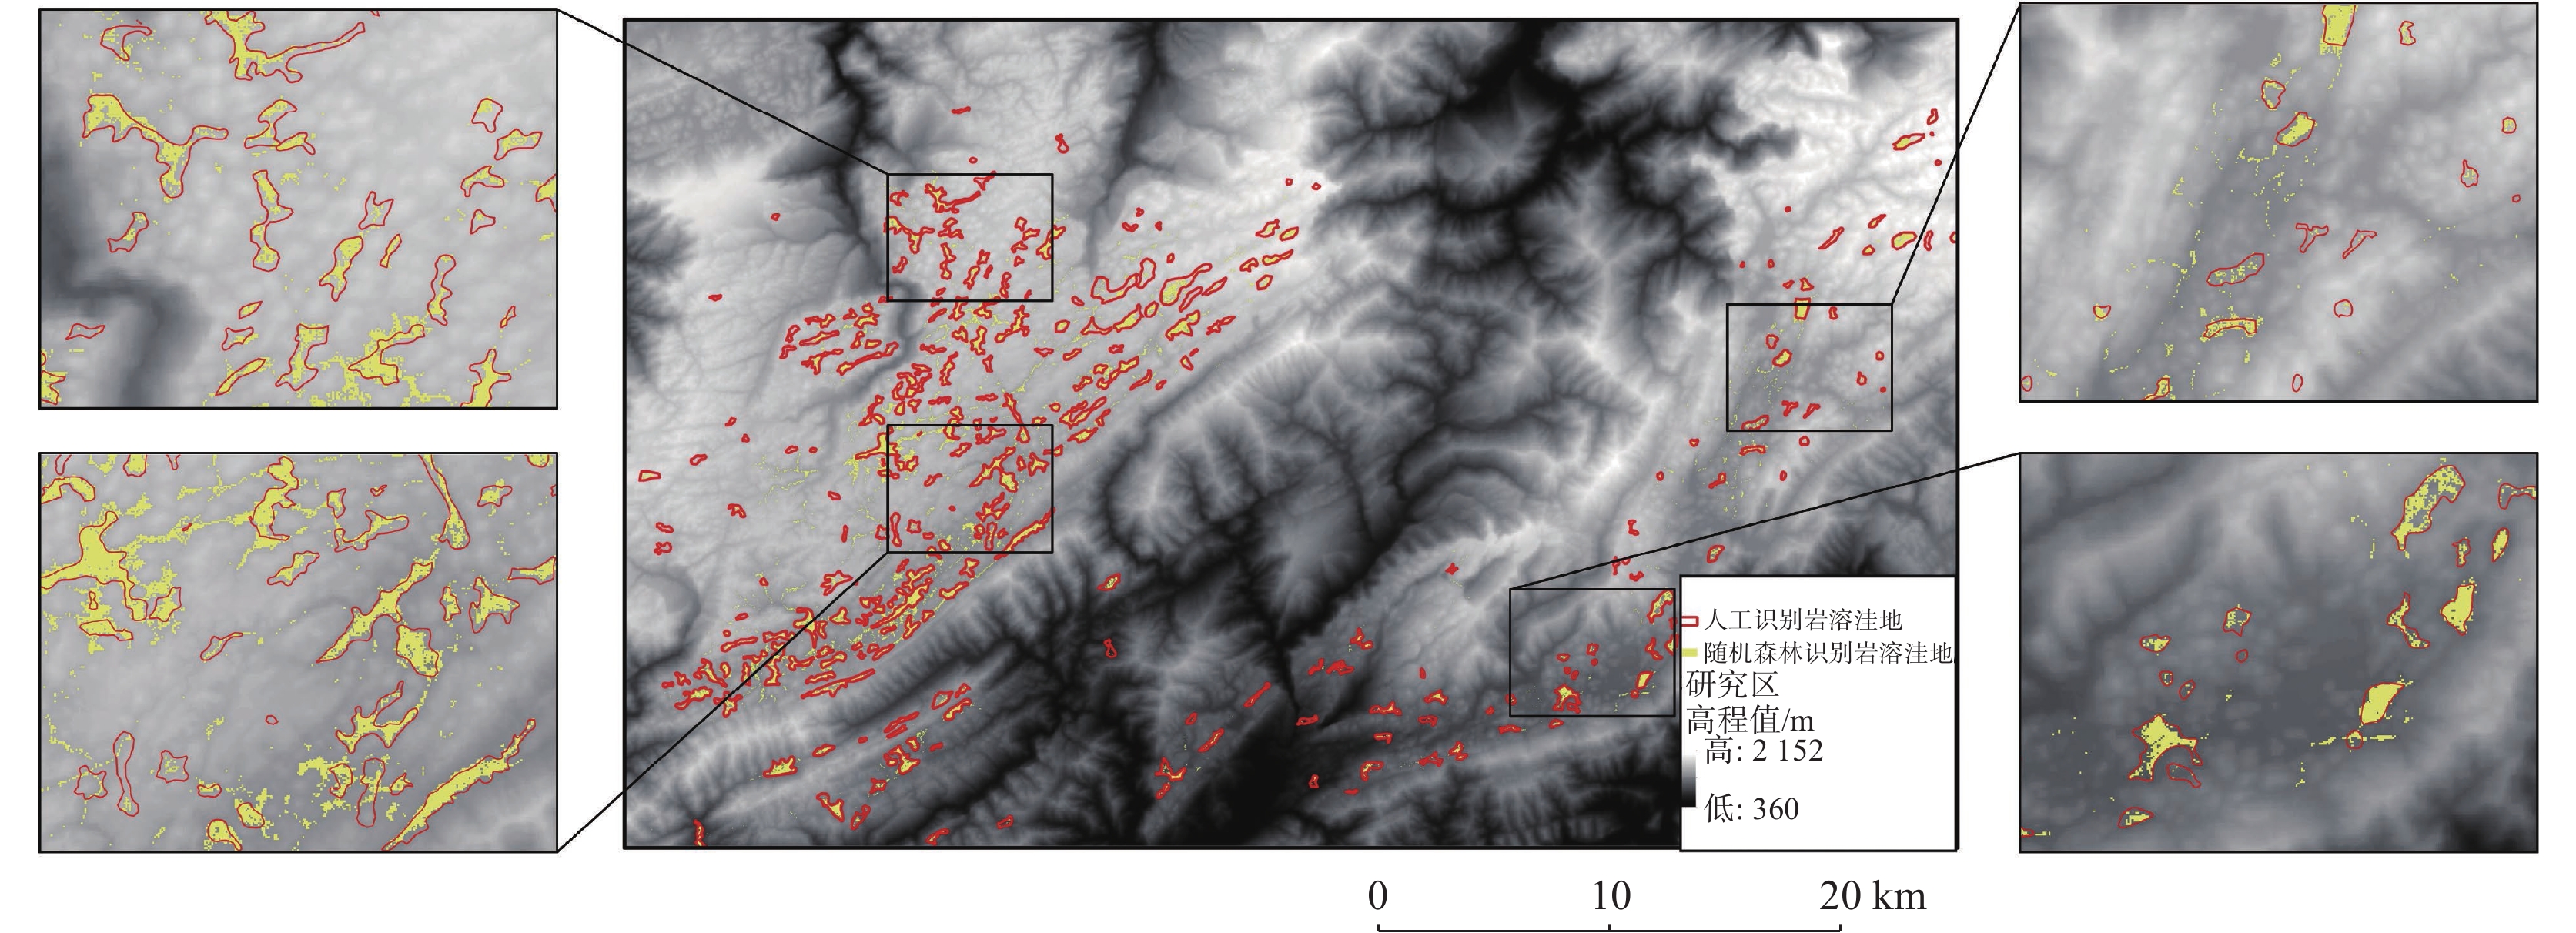
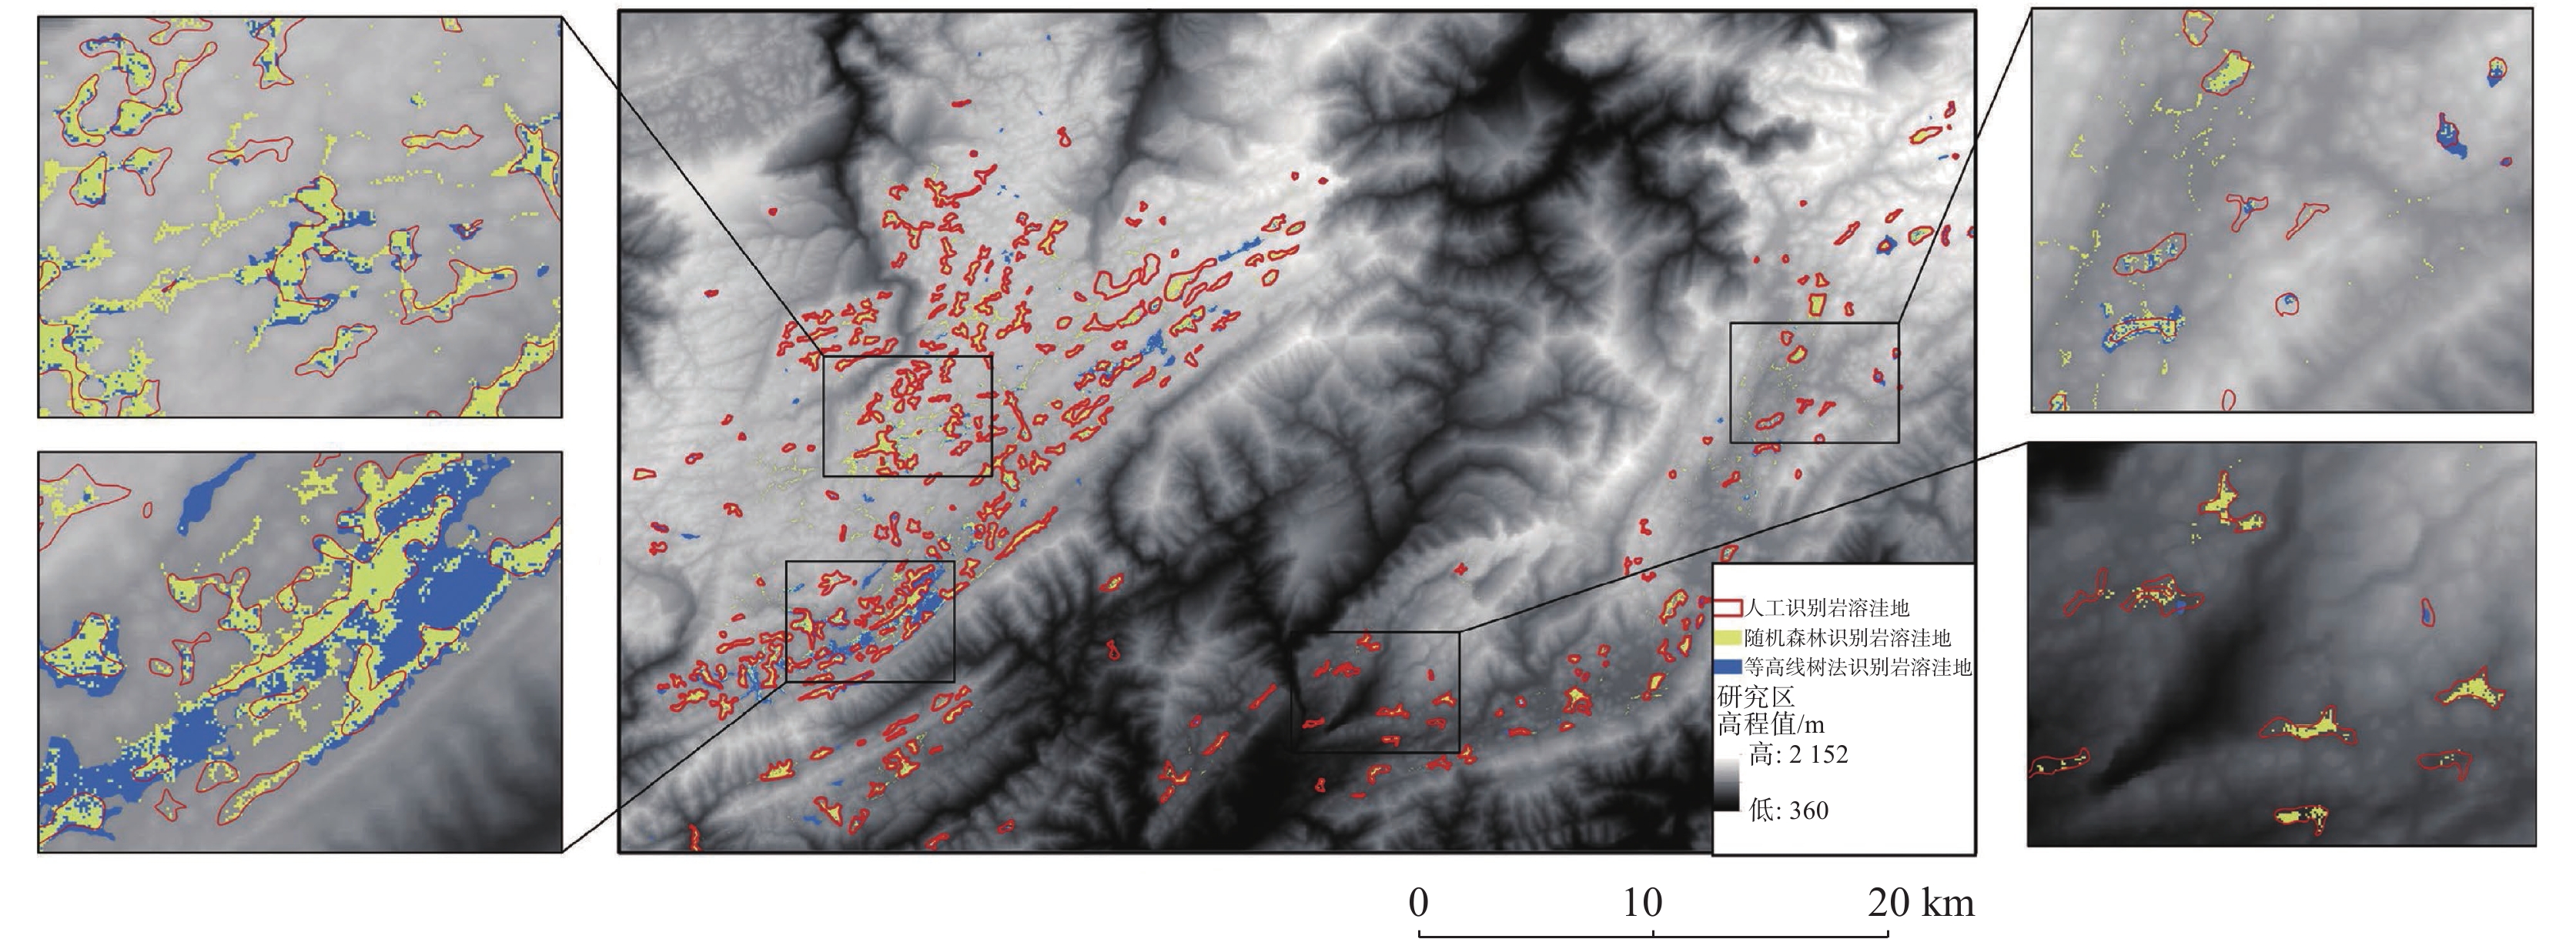
图 21 Geo-LCTA和RF模型识别出的岩溶洼地与实际岩溶洼地对比
Figure 21. Comparison of karst depressions identified by Geo-LCTA and RF model with actual karst depressions
表 1 研究区的数据列表
Table 1. List of data in the study area
数据类型 空间分辨率/比例尺 数据用途 数据来源 DEM 30 m 提取高程 美国航空航天局开发的ASTER GDEM V3 地质图 1∶5万 提取地质岩性 湖北省地质调查局 水系图 1∶5万 提取水系 湖北省地质调查局 岩溶洼地人工解译数据库 1∶5万 检验算法模型 地质专家目视解译 遥感影像 30 m 提取土地利用数据 国家地理信息公用服务平台  下载: 导出CSV
表 2 30 m DEM的计算结果
Table 2. Calculation results of 30 m DEM
DEM/m 最小向下
精度/m最低等高
线/m等高线间
隔/m最小区域
面积/m2准确率/% 召回率/% F-measure/% D值/% 30 0.5 547 15 5500 33.51 87.50 48.46 50.80 30 45.16 80.90 57.96 64.15 60 62.17 65.63 63.85 85.86 15 6000 34.57 87.50 49.56 51.58 30 46.48 80.21 58.85 64.79 60 63.36 64.24 63.79 85.96 15 6500 35.41 86.81 50.30 52.55 30 47.20 79.17 59.14 66.05 60 63.41 63.19 63.30 86.41 15 7000 36.15 86.11 50.92 53.21 30 48.19 78.47 59.71 66.52 60 64.75 62.50 63.60 87.05 15 7500 37.18 85.07 51.74 53.72 30 49.00 76.74 59.81 67.18 60 66.04 60.76 63.29 88.68 15 8000 37.77 84.72 52.25 54.18 30 49.32 75.69 59.73 67.42 60 66.15 59.72 62.77 88.46 15 8500 38.88 84.38 53.23 54.72 30 50.59 75.00 60.42 68.38 60 66.15 59.03 62.39 88.33
下载: 导出CSV
表 3 12.5 m DEM的计算结果
Table 3. Calculation results of 12.5 m DEM
DEM/m 最小向下
精度/m最低等高
线/m等高线间
隔/m最小区域
面积/m2准确率/% 召回率/% F-measure/% D值/% 12.5 0.5 535 6.25 7000 33.20 89.24 48.40 48.97 12.50 38.58 85.07 53.09 56.06 25.00 50.66 80.21 62.10 66.67 6.25 7500 34.09 88.54 49.23 50.13 12.50 39.55 84.72 53.92 57.05 25.00 51.46 79.51 62.48 67.42 6.25 8000 34.63 86.81 49.50 50.69 12.50 40.03 82.99 54.01 57.96 25.00 52.45 78.13 62.76 68.30 6.25 8500 36.26 86.11 51.03 51.75 12.50 42.17 82.29 55.76 60.14 25.00 54.50 77.78 64.09 69.83 6.25 9000 37.71 85.76 52.39 53.59 12.50 43.76 81.60 56.97 62.01 25.00 56.78 77.08 65.39 72.12 6.25 9500 38.44 85.42 53.02 54.38 12.50 44.85 81.60 57.88 63.36 25.00 58.01 76.74 66.07 72.97 6.25 10000 39.30 85.42 53.83 55.43 12.50 45.81 81.60 58.68 62.77 25.00 59.41 76.74 66.97 74.46
下载: 导出CSV
表 4 易发性评价因子的分类、名称和描述
Table 4. Classification, names, and descriptions of susceptibility evaluation factors
类型 评价因子 单位 取值范围 地形地貌 高程 m 34~ 2295 坡向 − 1.平地;2.正北;3.北东;4.正东;5.南东;6.正南;7.南西;8.正西;9.北西 坡度 ° 0~79 曲率 − −21~22 斜坡形态 − 1.外凸坡;2.外凹坡;3.外直坡;4.内直坡;5.内凹坡;6.直凸坡;7.直凹坡;8.直线坡 地质 距构造距离 m 0~ 45387 地层岩性 − 1.硬岩;2.软硬相间岩;3.软岩 气象水文 距水系距离 m 0~ 16370 人类工程活动 土地利用 − 1.水域;2.草地;3.林地;4.耕地;5.建设用地;6.未利用地
下载: 导出CSV
表 5 统计学方法的计算结果
Table 5. Calculations by statistical method
易发性
概率/%识别个
数/个人工解译
个数/个识别准确
个数/个有效识别
个数/个准确率/% 召回率/% F-measure/% D值/% 90 5156 288 1431 276 5.35 95.83 10.14 27.75 95 4217 288 1870 262 6.21 90.97 11.63 44.34
下载: 导出CSV
表 6 统计学方法的比较结果
Table 6. Comparative results of statistical methods
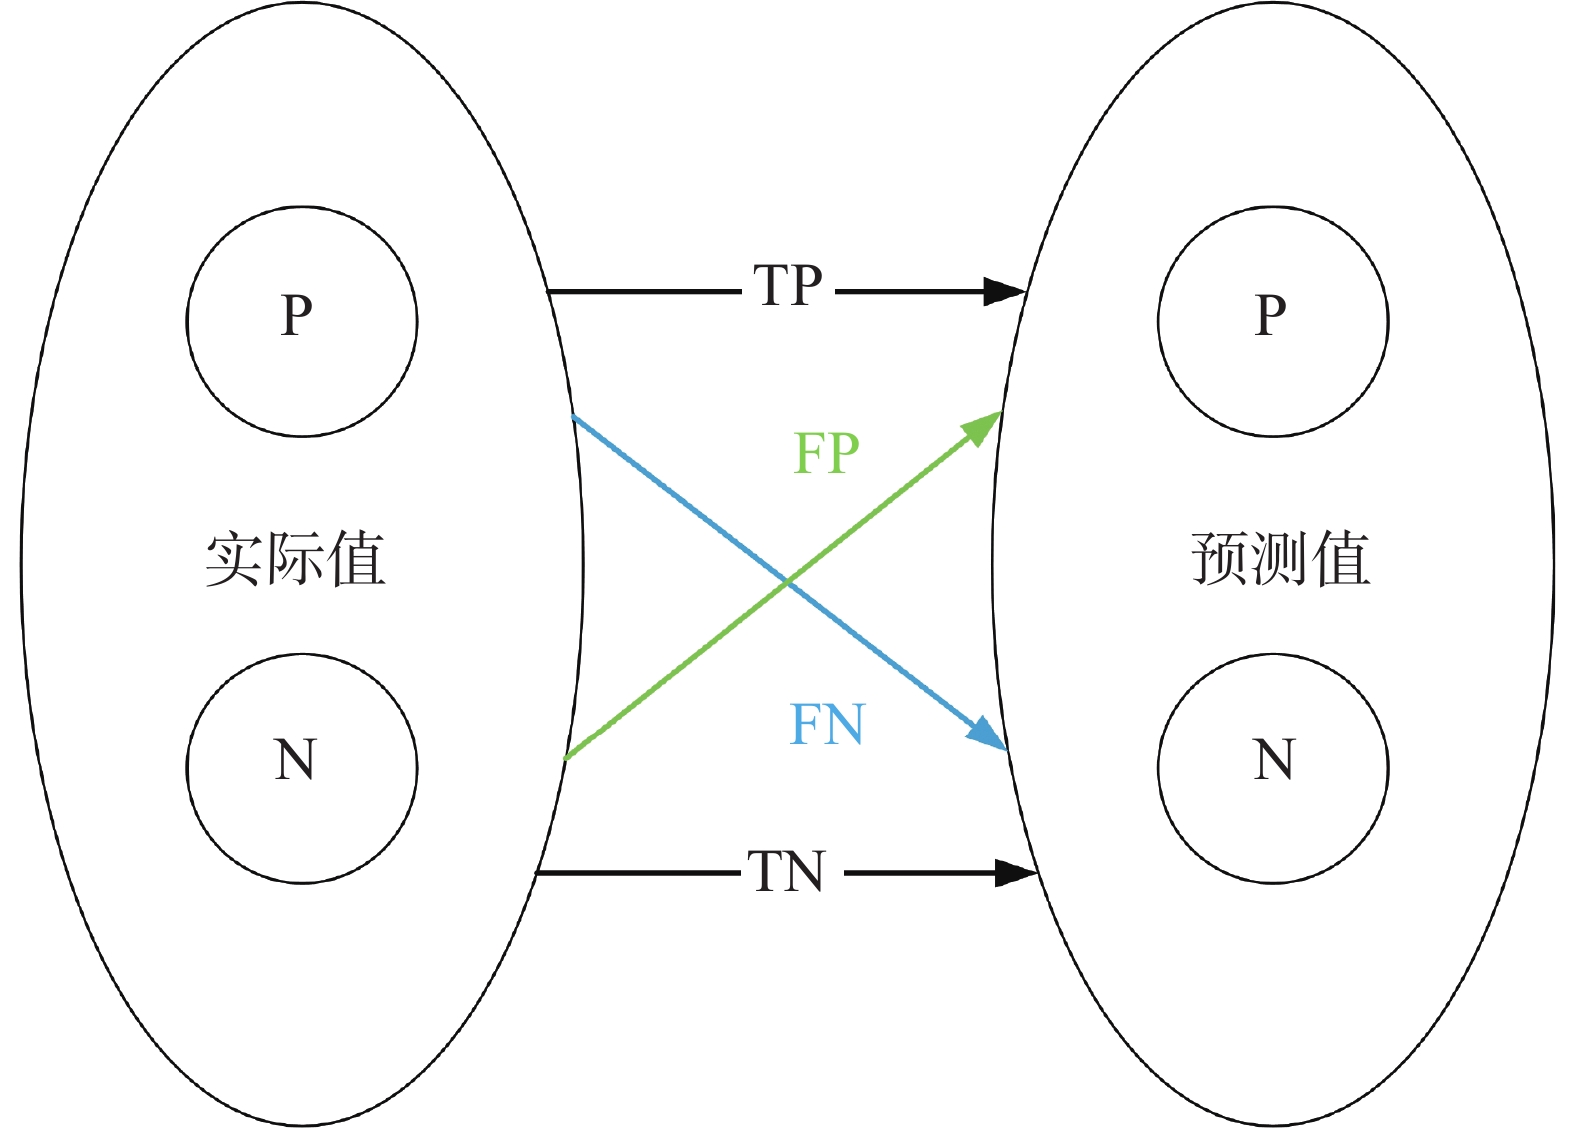
模型 准确率/% 召回率/% F-measure/% D值/% Geo-LCTA 66.15 59.03 62.39 88.33 RF 6.21 90.97 11.63 44.34
下载: 导出CSV
-
[1] 符明俊, 何阳, 董秀军, 邓博. 茂密植被山区岩溶漏斗遥感识别方法[J]. 中国岩溶, 2025, 44(1): 89-99. doi: 10.11932/karst20250106Fu Mingjie, He Yang, Dong Xiujun, Deng Bo. Remote sensing identification method for karst dolines in mountainous areas with dense vegetation[J]. Carsologica Sinica, 2025, 44(1): 89-99. doi: 10.11932/karst20250106 [2] 文俊, 董志明, 金建伟. 岩溶洼地区域公路建设技术问题及对策分析[J]. 交通建设与管理, 2024(1): 152-154. doi: 10.3969/j.issn.1673-8098.2024.01.053Wen Jun, Dong Zhiming, Jin Jianwei. Analysis on technical problems and countermeasures of highway construction in karst depression areas[J]. Transportation Construction and Management, 2024(1): 152-154. doi: 10.3969/j.issn.1673-8098.2024.01.053 [3] L Garas K, B Madrigal F M, D Agot D R, CanlasLiza C M, J Manzano S L. IFSAR-DEM在岩溶洼地探测中的应用: 以薄荷省旁劳市沉降灾害评估为例[J]. 中国岩溶, 2020, 39(6): 928-936.L Garas K, B Madrigal F M, D Agot D R, CanlasLiza C M, J Manzano S L. Application of IFSAR-DEM in karst depression Detection: A case study of subsidence disaster assessment in Panglao City, Bohol Province[J]. Carsologica Sinica, 2020, 39(6): 928-936. [4] Moran C J, Vezina G. Visualizing soil surface and crop residues[J]. IEEE Computer Graphics and Applications, 1993, 13(2) : 40-47. [5] L Wang, H Liu. An efficient method for identifying and filling surface depressions in digitial elevation models for hydrologic analysis and modeling[J]. International Journal of Geographical Information Science, 2006, 20(2): 193-213. doi: 10.1080/13658810500433453 [6] 王建平, 任立良, 吴益. 一种新的DEM填洼算法[J]. 地球信息科学, 2005, 7(3): 51-54. doi: 10.3969/j.issn.1560-8999.2005.03.012Wang Jianping, Ren Liliang, Wu Yi. A new DEM filling algorithm[J]. Geo-information Science, 2005, 7(3): 51-54. doi: 10.3969/j.issn.1560-8999.2005.03.012 [7] 杨邦, 任立良, 贺颖庆. 基于快速排序的数字高程模型分级填洼算法[J]. 计算机应用, 2009, 29(11): 3161-3164,3170. doi: 10.3724/SP.J.1087.2009.03161Yang Bang, Ren Liliang, He Yingqing. Hierarchical filling algorithm for digital elevation model based on quick sort[J]. Journal of Computer Applications, 2009, 29(11): 3161-3164,3170. doi: 10.3724/SP.J.1087.2009.03161 [8] 李辉, 陈晓玲, 张利华, 李长安. 基于三方向搜索的DEM中洼地处理方法[J]. 水科学进展, 2009, 20(4): 473-479.Li Hui, Chen Xiaoling, Zhang Lihua, Li Changan. Depression removal method for grid DEM based on three-direction search[J].Advances in Water Science, 2009, 20(4): 473-479. [9] 曾向辉, 曲树国, 冯杰. 一种改进的DEM数字水系简易提取方法研究[J]. 水利水电技术, 2015, 46(3): 17-21. doi: 10.13928/j.cnki.wrahe.2015.03.004Zeng Xianghui, Qu Shuguo, Feng Jie. Research on an improved simple extraction method of DEM digital water system[J]. Water Resources and Hydropower Engineering, 2015, 46(3): 17-21. doi: 10.13928/j.cnki.wrahe.2015.03.004 [10] 潘华志, 昝良. 利用包含关系建立等高线树的研究[J]. 测绘, 2015, 38(4): 147-150.Pan Huazhi, Zan Liang. Research on establishing contour trees using containment relationships[J]. Surveying and Mapping, 2015, 38(4): 147-150. [11] 张威. 基于等高线簇的等高线树构建方法研究[J]. 科学技术创新, 2017(22): 69-70.Zhang Wei. Research on contour tree construction method based on contour clusters[J]. Science and Technology Innovation, 2017(22): 69-70. [12] 钱叶青. 基于等高线树的峰林峰丛地表形态特征研究[D]. 南京: 南京师范大学, 2017.Qian Yeqing. Study on surface morphological characteristics of peak forest peak cluster based on contour tree[D]. Nanjing: Nanjing Normal University, 2017. [13] 闫吉星, 李锡伟, 徐剑平. 基于等高线树的洼地判别方法[J]. 测绘与空间地理信息, 2010, 33(3): 229-231.Yan Jixing, Li Xiwei, Xu Jianping.An automatic method for selecting depression contour lines based on contour tree[J]. Geomatics&Spatial Information Technology, 2010, 33(3): 229-231. [14] 杨光照. 岩溶山区高位地下河成库条件研究[D]. 贵阳: 贵州大学, 2008.Yang Guangzhao. Study on reservoir formation conditions of high-level underground river in karst mountainous area[D]. Guiyang: Guizhou University, 2008. [15] 李婷, 李江风. 恩施大峡谷–腾龙洞世界地质公园地质遗迹特征及价值研究[J]. 中国岩溶, 2025, 44(1): 170-185.Li Ting, Li Jiangfeng. Research on the characteristics and value of geological relics in the Enshi Grand Canyon-Tenglongdong Cave Global Geopark[J]. Carsologica Sinica, 2025, 44(1): 170-185. [16] 刘燚, 康凤新, 张文强, 许庆宇, 秦鹏, 赵强, 李嘉龙, 崔洋, 隋海波, 郑婷婷.济南长孝岩溶水系统地下水富集区补给源识别及其成因机制[J].地质科技通报, 2024, 43(6): 292-305.Liu Yi, Kang Fengxin, Zhang Wenqiang, Xu Qingyu, Qin Peng, Zhao Qiang, Li Jialong, Cui Yang, Sui Haibo, Zheng Tingting. Identification and genetic mechanism of recharge sources in groundwater-rich area of Changxiao karst water system in Jinan City[J]. Bulletin of Geological Science and Technology, 2024, 43(6): 292-305. [17] 郭沛沛, 李成名, 殷勇, 丁圣陶. 基于相邻关系的等高线树建立算法研究[J]. 中国工程科学, 2013, 15(5): 42-46. doi: 10.3969/j.issn.1009-1742.2013.05.008Guo Peipei, Li Chengming, Yin Yong, Ding Shengtao. An algorithm of neighbor relationship oriented contour tree building[J]. Strategic Study of CAE, 2013, 15(5): 42-46. doi: 10.3969/j.issn.1009-1742.2013.05.008 [18] 郑毅. 等高线树三维扩展模型及其在地貌形态特征分析中的应用[D]. 南京: 南京师范大学, 2018.Zheng Yi. Three-dimensional extended model of contour tree and its application in the analysis of geomorphological characteristics[D]. Nanjing: Nanjing Normal University, 2018. [19] 宋小川, 刘汉湖, 张春, 周林博. 确定性系数模型的滑坡易发性评价应用与比较[J]. 矿山测量, 2021, 49(5): 65-71.Song Xiaochuan, Liu Hanhu, Zhang Chun, Zhou Linbo. Application and comparison of landslide susceptibility evaluation of deterministic coefficient model[J]. Mine Measurement, 2021, 49(5): 65-71. [20] 黄成, 邓云龙, 晏祥省, 周鑫城. 基于多模型的滑坡易发性评估研究[J]. 中国岩溶, 2024, 43(6): 1386-1397.Huang Cheng, Deng Yunlong, Yan Xiangsheng, Zhou Xincheng. A study on multiple-model evaluation of landslide susceptibility[J]. Carsologica Sinica, 2024, 43(6): 1386-1397. [21] De Castro Tayer T, Rodrigues P C H. Assessment of a semi-automatic spatial analysis method to identify and map sinkholes in the Carste Lagoa Santa environmental protection unit, Brazil[J]. Environmental Earth Sciences, 2021, 80(3): 83-97. [22] Chen H, Oguchi T, Wu P. Morphometric analysis of sinkholes using a semi-automatic approach in Zhijin County, China[J]. Arabian Journal of Geosciences, 2018, 11(15): 1-14. [23] Lin S, Liang Z L, Guo H W, Hu Q K, Cao X T L, Zheng H. Application of machine learning in early warning system of geotechnical disaster: A systematic and comprehensive review[J]. Artificial Intelligence Review, 2025, 58(6): 1-35. [24] Asghar A, Su L J, Zhao B, Usmani N A. Integrating predictive modeling techniques with geospatial data for landslide susceptibility assessment in northern Pakistan[J]. Journal of Mountain Science, 2023, 20(9): 2603-2627. [25] Segoni S, Tofani V, Rosi A, Catani F, Casagli N. Combination of rainfall thresholds and susceptibility maps for dynamic landslide hazard assessment at regional scale[J]. Frontiers in Earth Science, 2018, 6: 85. -

 点击查看大图
计量
- 文章访问数: 826
- HTML浏览量: 87
- PDF下载量: 24
- 被引次数: 0
