Exploration of superficial soil-rock structure for karst area based on frequency domain electromagnetic method
-
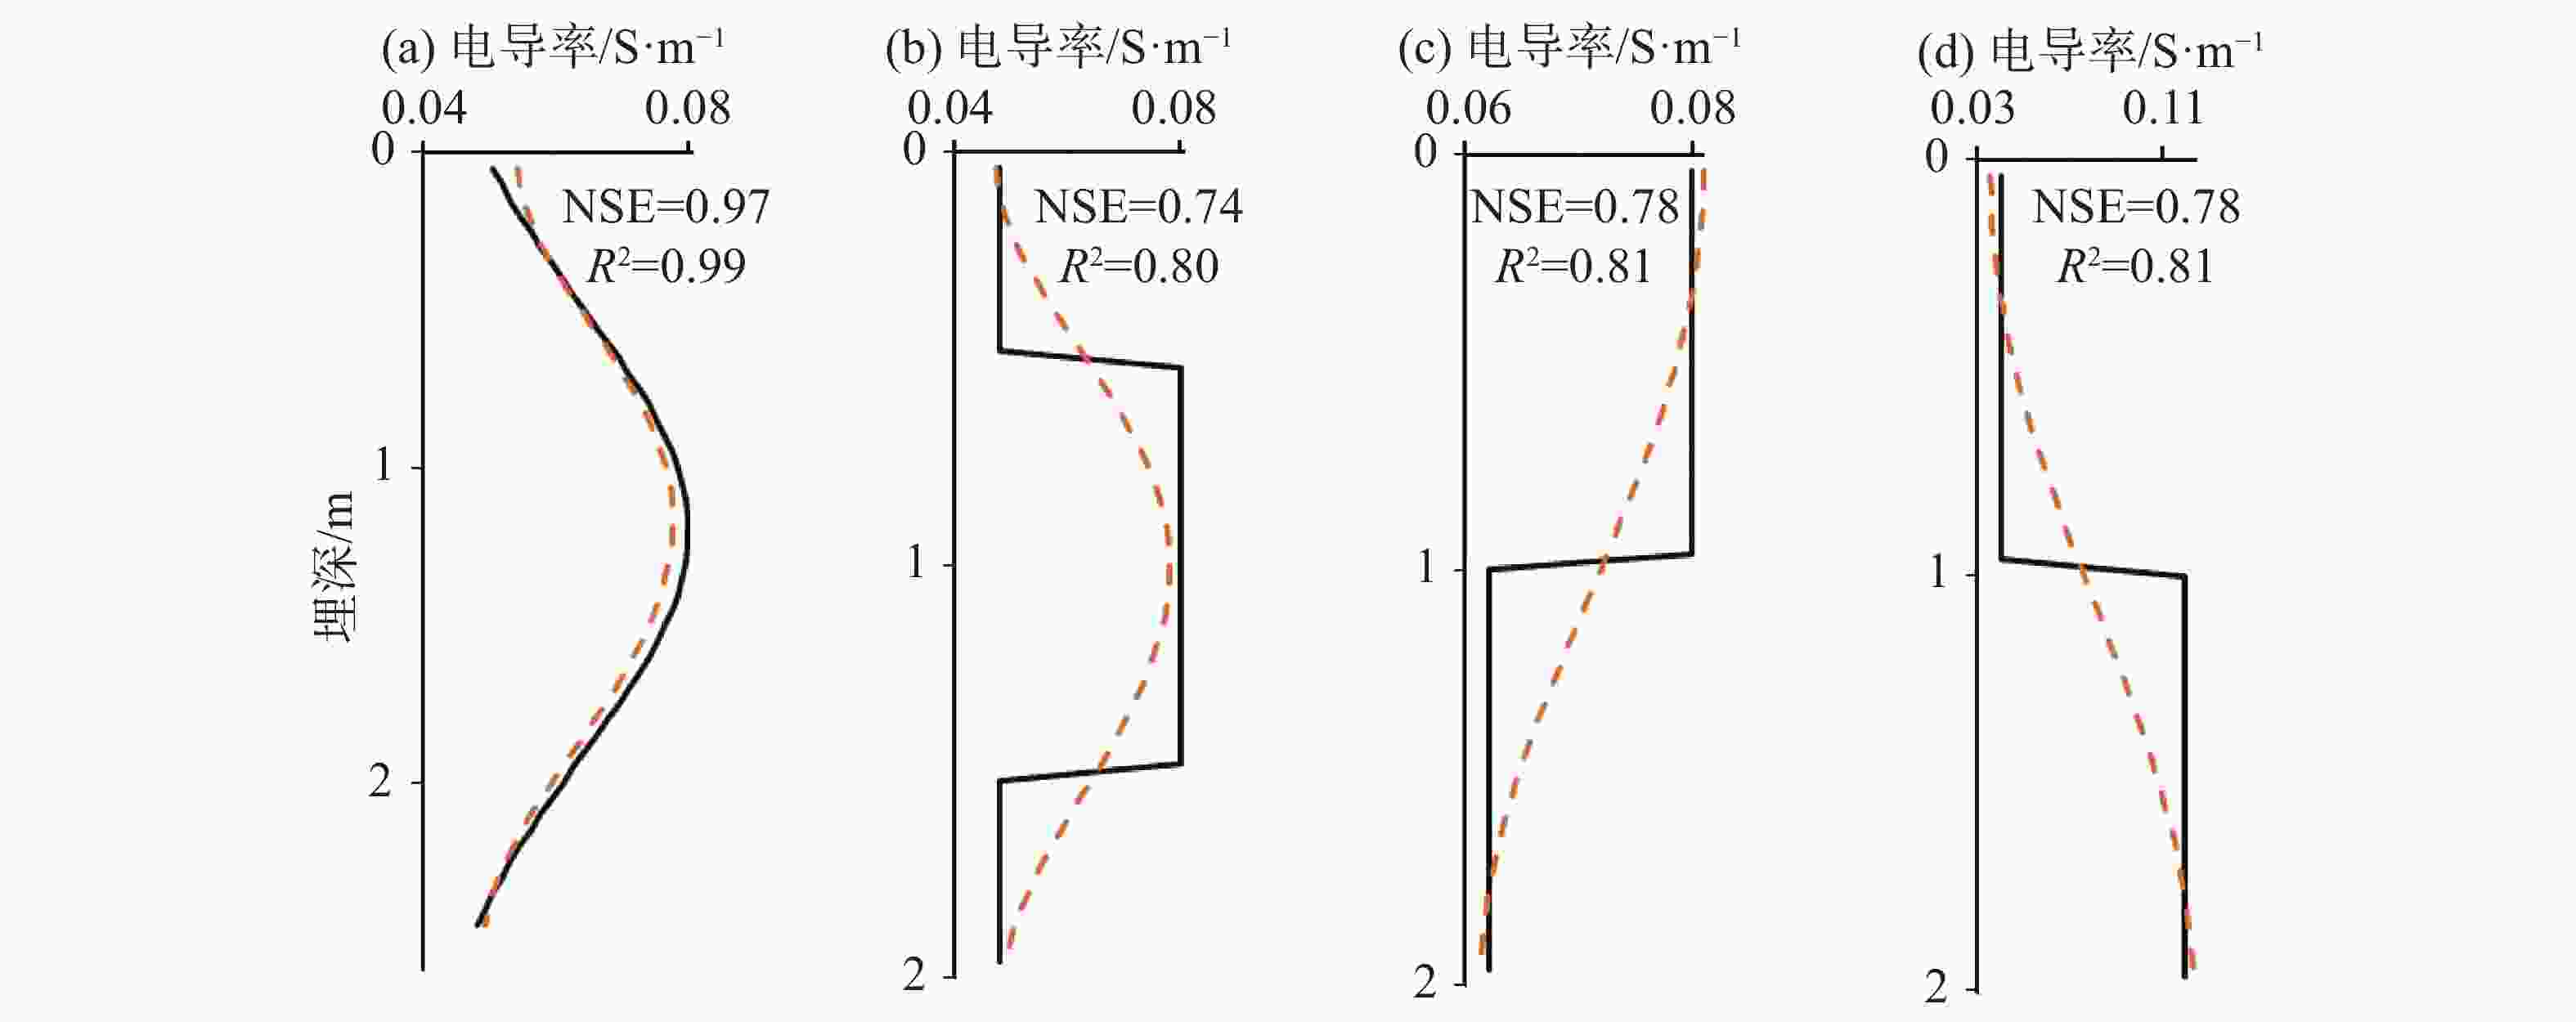
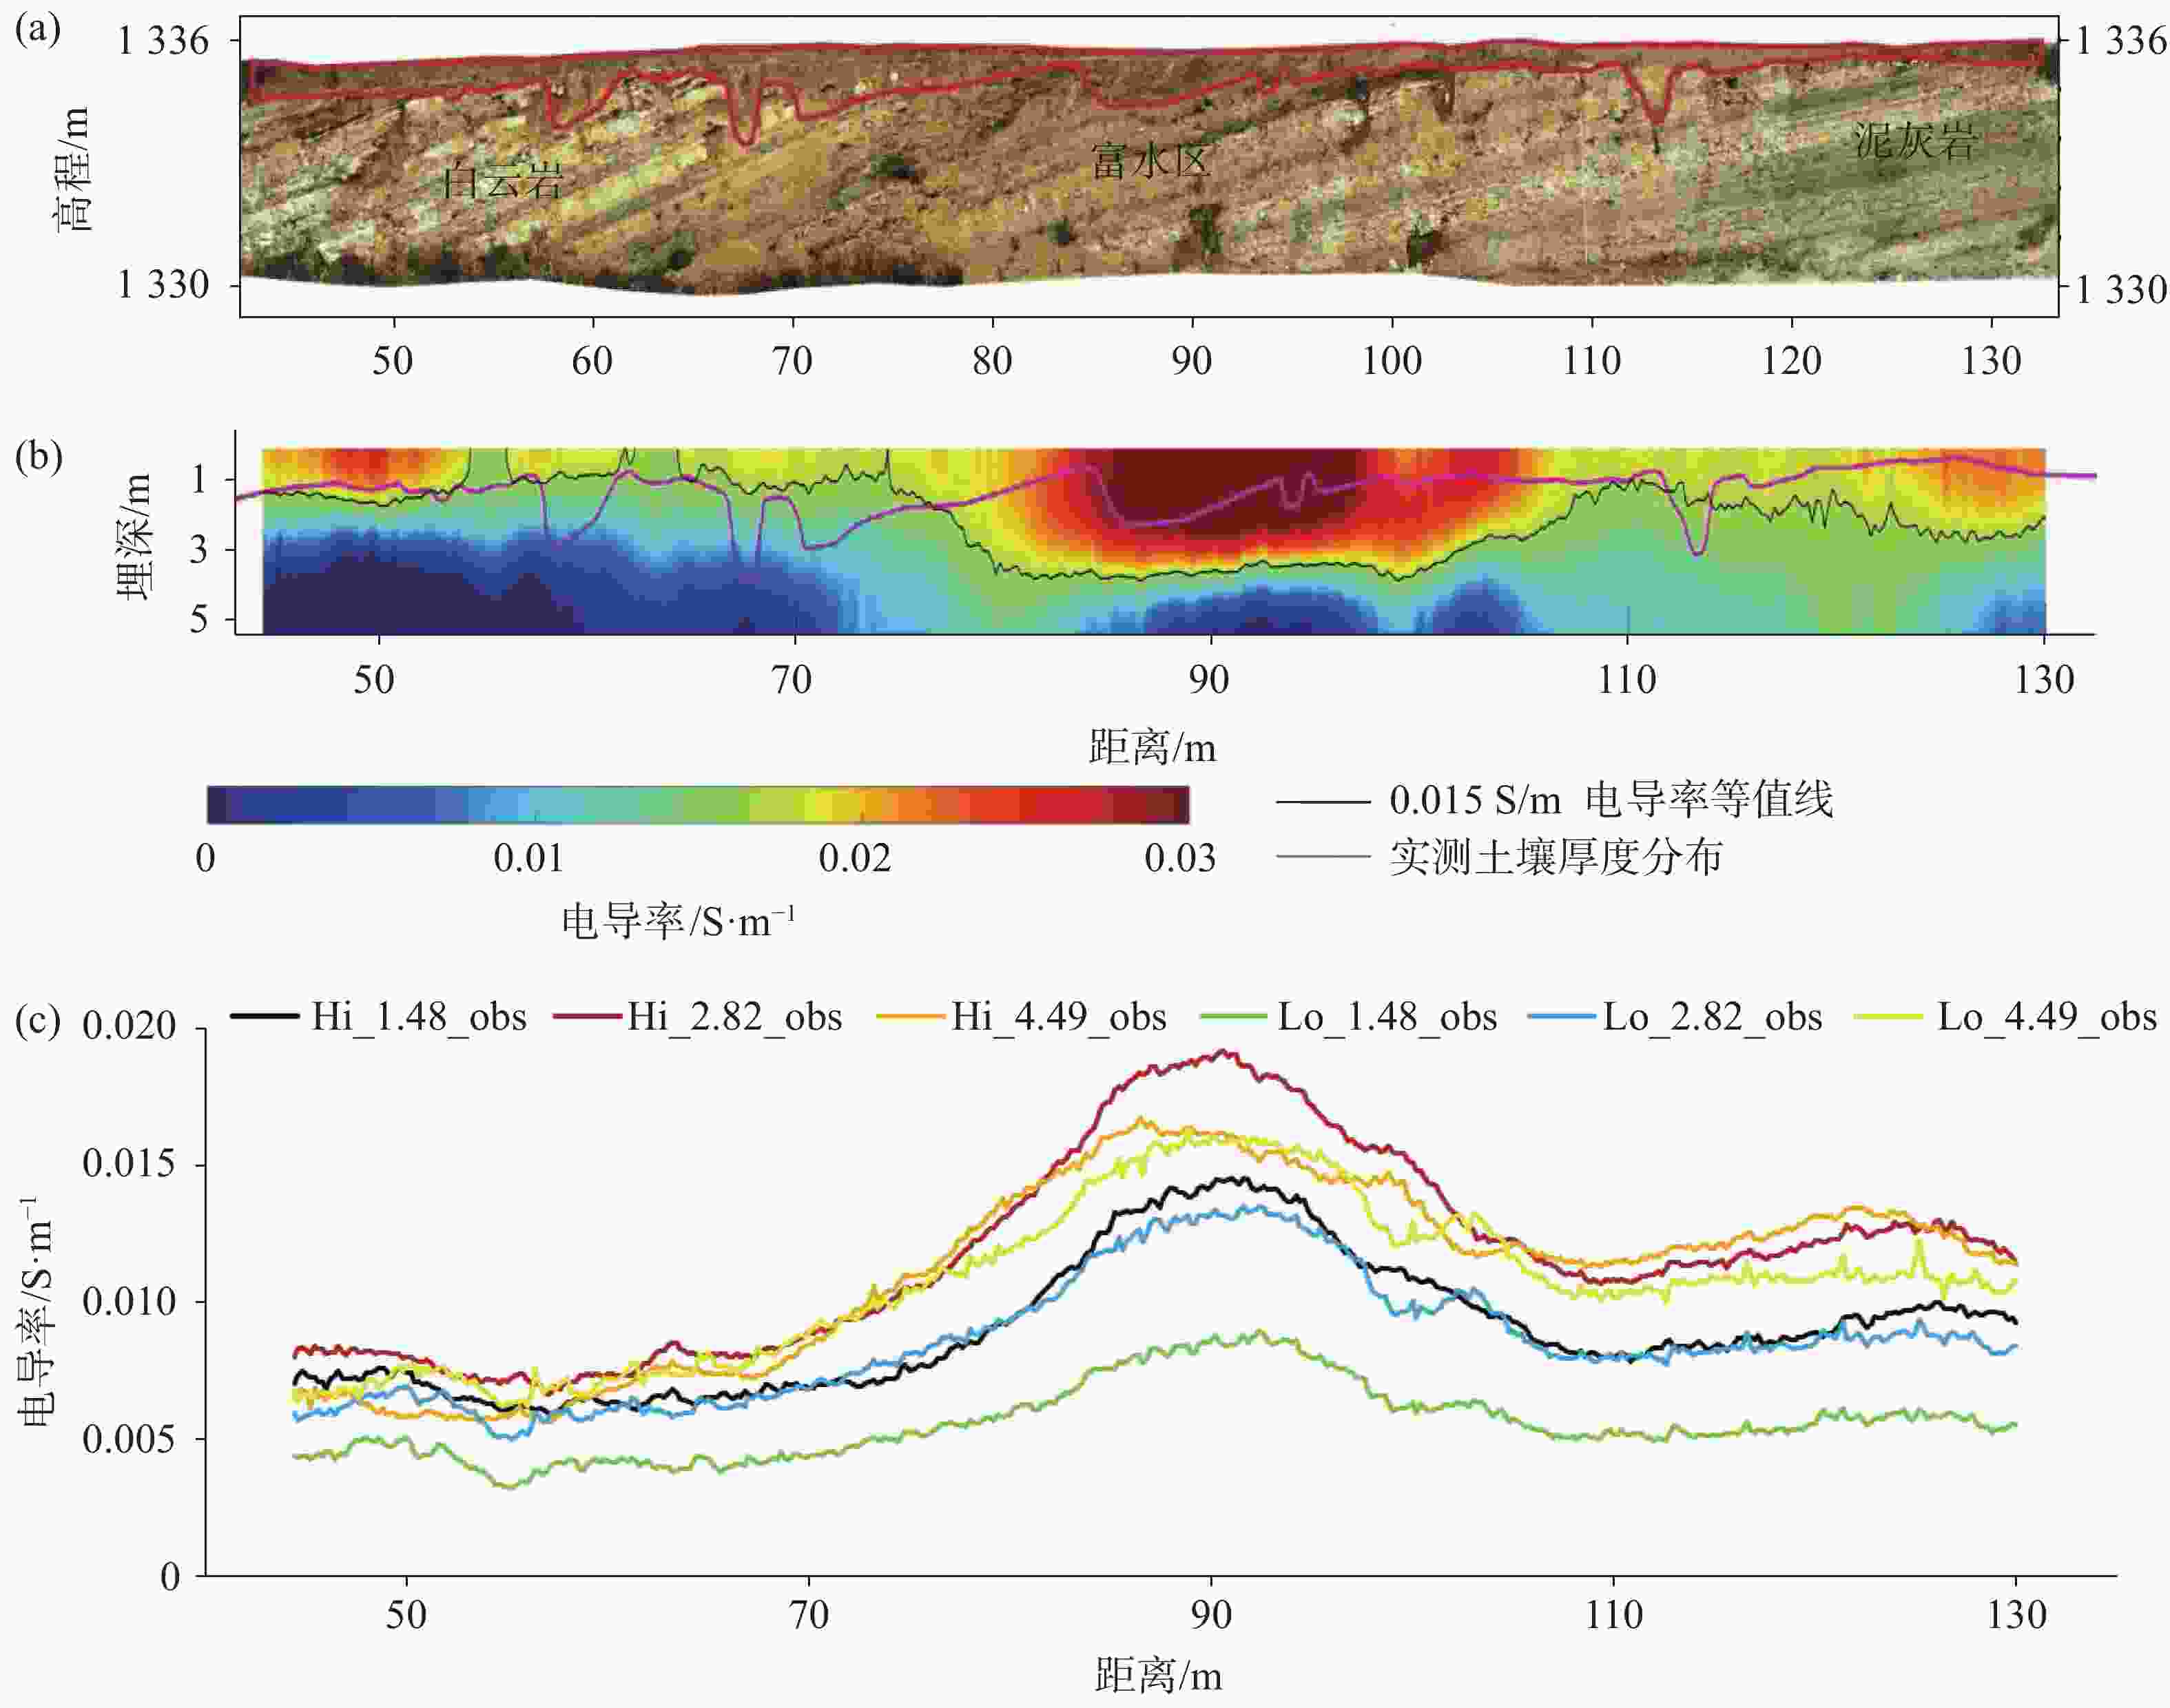
摘要: 喀斯特地区浅表层土壤分布极不均匀,探测土-岩界面和土壤分布对区域水文以及生态环境研究具有重要意义。文章基于麦克斯韦方程组构建了频域电磁法(FDEM)探测的电导率(EC)一维反演模型,实现了喀斯特浅表剖面EC可视化表述。根据设定的理想地层EC数据以及南方喀斯特峰丛洼地两个剖面和出露的三个实测剖面的FDEM实测视电导率,结合高密度电法、剖面实测土-岩界面,检验了反演模型可靠性。结果表明:FDEM法反演结果能较好的描述理想地层EC变化,以及土壤与灰岩、白云岩界面EC分布,进而可辨识土壤厚度分布,但基于反演的EC值判别尺度较小的溶沟(槽)以及泥岩区土-岩界面误差较大。Abstract: Soil thickness as a key hydrological and ecological factor, is distributed extremely uneven in karst areas. The explorations of the soil thickness and soil-rock interfaces are still challenge. In this study, a 1-D electrical conductivity (EC) inversion model was developed for the frequency domain electromagnetic method (EMI) based on Maxwell's equation system. The visualization of EC distribution for soil profile in karst area could be realized by the model. The inversion model was validated according to the given ideal stratigraphic EC
data and applied to two detection lines and the three exposed profiles at a karst depression. The detected apparent electrical conductivities and soil-rock interfaces from EMI are further compared with those from high-density electrical method. The results showed that the inversion from EMI can capture the variation of ECat ideal strata and interfaces of soil layer and underlying limestone and dolomite bedrock at field. The distribution of soil thickness could be estimated with the detected soil-rock interface. However, there is relatively low accuracy when the model is applied to detect trench (trough) at the small scale or the soil-rock interfaces with mudstone. -
表 1 正演模型模拟与反演ECa结果对比
Table 1. Comparison of the simulated and inverted ECa values
线圈模式 HCP VCP 残差 线圈距离/m 1.48 2.82 4.49 1.48 2.82 4.49 a 模拟
ECa/S·m−10.059 2 0.051 8 0.043 8 0.059 3 0.057 5 0.053 8 0.000 2 反演
ECa/S·m−10.058 8 0.051 7 0.0441 0.059 5 0.057 5 0.053 9 b 模拟
ECa/S·m−10.064 1 0.055 9 0.048 6 0.071 5 0.065 9 0.060 7 0.000 3 反演
ECa/S·m−10.064 1 0.055 8 0.048 7 0.071 5 0.065 8 0.060 7 c 模拟
ECa/S·m−10.064 1 0.055 9 0.0486 0.0715 0.065 9 0.060 7 0.000 2 反演
ECa/S·m−10.064 1 0.055 8 0.048 7 0.071 5 0.065 8 0.060 7 d 模拟
ECa/S·m−10.076 9 0.082 8 0.077 4 0.061 2 0.070 7 0.074 4 0.000 0 反演
ECa/S·m−10.076 7 0.083 1 0.077 2 0.061 2 0.070 8 0.074 5 -
[1] Ford D, Williams P D. Karst hydrogeology and geomorphology[M]. New York: John Wiley & Sons, 2013. [2] 陈喜. 西南喀斯特地区水循环过程及其水文生态效应[M]. 北京: 科学出版社, 2014.CHEN Xi. Water cycle processes and hydro-ecological effects in the southwest karst region[M]. Beijing: Science Press, 2014. [3] 王甲荣, 陈喜, 张志才, 张润润, 朱彪, 龚轶芳, 刘皓, 袁瞬飞. 喀斯特溶槽岩-土界面优势流及其对土壤水分动态的影响[J]. 中国岩溶, 2019, 38(1):109-116.WANG Jiarong, CHEN Xi, ZHANG Zhicai, ZHANG Runrun, ZHU Biao, GONG Yifang, LIU Hao, YUAN Shunfei. Preference flow at rock-soil interface and its influence on soil water dynamics in the karst troughs[J]. Carsologica Sinica, 2019, 38(1):109-116. [4] Archie, G. E. The electrical resistivity log as an aid in determining some reservoir characteristics[J]. Transactions of the Aime, 1942, 146(1):54-62. doi: 10.2118/942054-G [5] Revil A, Cathles L M, Losh S, Nunn J.A Electrical conductivity in shaly sands with geophysical applications[J]. Journal of Geophysical Research Solid Earth, 1998, 103(B10):23925-23936. doi: 10.1029/98JB02125 [6] Corwin D L , Lesch S M , Shouse P J , Soppe R, Ayars J E. Identifing soil properties that influence cotton yield using soil sampling directed by apparent bulk soil electrical conductivity[J]. Agronomy Journal, 2003, 95(2). [7] Zhang Z, Routh P S, Oldenburg D W, Alumbaugh D L, Newman G A. Reconstruction of 1-D conductivity from dual-loop EM data[J]. Geophysics, 2000, 65(2):492-501. doi: 10.1190/1.1444743 [8] Moghadas D, Jadoon K Z, Mccabe M F. Spatiotemporal monitoring of soil moisture from EMI data using DCT-based Bayesian inference and neural network[J]. Journal of Applied Geophysics, 2019, 169:226-238. doi: 10.1016/j.jappgeo.2019.07.004 [9] Akramkhanov A , Brus D J, Walvoort D J J. Geostatistical monitoring of soil salinity in Uzbekistan by repeated \\{EMI\\ surveys[J]. Geoderma, 2014, 213: 600-607. [10] Cheng Qinbo, Tao Min, Chen Xi, Binley A. Evaluation of electrical resistivity tomography (ERT) for mapping the soil–rock interface in karstic environments[J]. Environmental Earth Sciences, 2019, 78(15):1-14. [11] Cheng Qinbo, Chen Xi, Tao Min, Binley A. Characterization of karst structures using quasi-3D electrical resistivity tomography[J]. Environmental Earth Sciences, 2019, 78(9):1-12. [12] Jadoon K Z, Moghadas D, Jadoon A, Missimer T M, Al-Mashharawi S K, McCabe M F. Estimation of soil salinity in a drip irrigation system by using joint inversion of multicoil electromagnetic induction measurements[J]. Water Resources Research, 2015, 51 (5):3490-3504. [13] Selepeng A T. Three Dimensional Numerical Modeling of Loop-Loop Electromagnetic Data at Low Induction Numbers[J]. 2016. [14] Santos F. 1-D laterally constrained inversion of EM34 profiling data[J]. Journal of Applied Geophysics, 2004, 56(2):123-134. doi: 10.1016/j.jappgeo.2004.04.005 [15] Dafflon B, Hubbard S S, Ulrich C, Peterson J E. Electrical Conductivity Imaging of Active Layer and Permafrost in an Arctic Ecosystem, through Advanced Inversion of Electromagnetic Induction Data[J]. Vadose Zone Journal, 2013, 12(4):1742-1751. [16] Moghadas D, Jadoon K Z, Mccabe M F. Spatiotemporal monitoring of soil water content profiles in an irrigated field using probabilistic inversion of time-lapse EMI data[J]. Advances in Water Resources, 2017, 110:238-248. [17] Mclachlan P, Blanchy G, Binley A. EMagPy: open-source standalone software for processing, forward modeling and inversion of electromagnetic induction data[J]. Computers & Geosciences, 2020:104561. [18] Wait J. Geo-electromagnetism[M]. Amsterdam: Elsevier, 2012. [19] Deidda G P, Diaz De Alba P, Rodriguez G. Identifying the magnetic permeability in multi-frequency EM data inversion[J]. 2017. [20] Chalikakis K, Plagnes V, Guerin R, Valois R, Bosch F. Contribution of geophysical methods to karst-system exploration: an overview[J]. Hydrogeology Journal, 2011, 19(6):1169-1180. doi: 10.1007/s10040-011-0746-x [21] Loke M H, Chambers J E, Rucker D F, Kuras O, Wilkinson P B. Recent developments in the direct-current geoelectrical imaging method[J]. Journal of Applied Geophysics, 2013, 95(8): 135-156. -


 下载:
下载:
