

MODFLOW-based analysis on seepage in discrete fissure networks
-
摘要: 岩溶基岩裂隙水文研究考虑裂隙非均质和各向异性建模较难。裂隙−连续介质模型(FC)从原理上能够比较真实地刻画实际的渗流形态,是岩溶地区较理想的水文模型。基于裂隙空间形态及分布的统计特性,应用Monte Carlo模拟技术和图论,采用MATLAB 程序生成二维裂隙网络原图及三级连通图,将第三级连通图映射到有限差分网格,建立离散裂隙网络(DFN)与MODFLOW相结合的FC渗流模型,编制相应的渗流模拟程序。复现交叉裂隙试验工况,及通过2个多裂隙算例分析有限差分网格分辨率以及裂隙死端对稳定渗流模拟精度的影响,以DFN渗流为准则,验证FC模型代码编写的正确性和有效性。结果表明:FC模型模拟的节点水头、总网格流、裂隙长度在粗网格的高估或低估,通过细化网格可大大消除这种影响,裂隙死端对FC模型的MODFLOW网格流模拟具有不可忽略的影响。本研究实现了裂隙渗透性非均质和各向异性在数值计算单元的表达,将促进对基于连通性的裂隙流的MODFLOW模拟理解。Abstract:
Studies on karst bedrock fissures face challenge in modeling due to the heterogeneity and anisotropy of fissures. Groundwater primarily flows through fissure and pipe networks within karst aquifer systems, while the bedrock pores and micro-fissures mainly serve as water storage. Therefore, the ideal hydrological model for karst areas is the continuum–fissure–pipe model. Fissures, as the main pathway for groundwater flow, significantly influence seepage in fissure media due to their connectivity. The fissure–continuum model (FC), which integrates the advantages of continuum models and discrete fissure network (DFN) models, can realistically characterize the dual texture of karst aquifers. The FC model can also account for matrix diffusion and water exchange between the matrix and fissures. However, this model remains challenging to accurately determine water exchange between rock matrix and fissure media. This study was based on the statistical distribution of fissure geometry and hydraulic parameters. It utilized the Monte Carlo stochastic simulation technique and MATLAB program to generate a two-dimensional fissure network diagram that mirrored the distribution of actual rock fissures. The adjacency matrix of an undirected graph of graph theory was employed to represent the intersection relationships between fissures in the fissure network. In addition, this study utilized percolation theory to eliminate isolated fissures and clusters of isolated fissures that cannot conduct fluid. This approach facilitated the generation of a first-level connectivity diagram. Fissures with single nodes were then eliminated to create a second-level connectivity diagram, and dead-ends in fissures were eliminated to generate a third-level connectivity diagram. Based on the connectivity diagrams of fissure networks, the cubic law and the continuity equation for seepage were applied to establish a single-phase, saturated, and stable DFN model. Each fissure in the connectivity diagram was mapped onto a finite difference grid to develop an FC model that combines DFN with MODFLOW. When eliminating the fissure dead-ends, computational rounding may result in the loss of some nodes. Therefore, the second-level and third-level connectivity diagrams were separately used for DFN seepage simulation and FC seepage simulation, respectively. Simulation programs were developed to reproduce cross-fissure test scenarios, and two multi-fissure cases were analyzed to investigate the effects of finite difference grid resolution and fissure dead-ends on the accuracy of stable seepage simulations. The DFN was used as a metric to evaluate the correctness and validity of FC model code writing. This study was based on the statistical distribution of fissure geometry and hydraulic parameters. It utilized the Monte Carlo stochastic simulation technique and MATLAB program to generate a two-dimensional fissure network diagram that mirrored the distribution of actual rock fissures. The adjacency matrix of an undirected graph of graph theory was employed to represent the intersection relationships between fissures in the fissure network. In addition, this study utilized percolation theory to eliminate isolated fissures and clusters of isolated fissures that cannot conduct fluid. This approach facilitated the generation of a first-level connectivity diagram. Fissures with single nodes were then eliminated to create a second-level connectivity diagram, and dead-ends in fissures were eliminated to generate a third-level connectivity diagram. Based on the connectivity diagrams of fissure networks, the cubic law and the continuity equation for seepage were applied to establish a single-phase, saturated, and stable DFN model. Each fissure in the connectivity diagram was mapped onto a finite difference grid to develop an FC model that combines DFN with MODFLOW. When eliminating the fissure dead-ends, computational rounding may result in the loss of some nodes. Therefore, the second-level and third-level connectivity diagrams were separately used for DFN seepage simulation and FC seepage simulation, respectively. Simulation programs were developed to reproduce cross-fissure test scenarios, and two multi-fissure cases were analyzed to investigate the effects of finite difference grid resolution and fissure dead-ends on the accuracy of stable seepage simulations. The DFN was used as a metric to evaluate the correctness and validity of FC model code writing. Results show that the total flow simulation values and head simulation of the fine grid under the two test conditions are in good agreement with the theoretical values of DFN. However, the node heads and total grid flow simulated by the FC model in two cases are either overestimated or underestimated in the coarse grid. Although elongated paths of grid flow Lg between cells are corrected by increasing the permeability coefficients of the cells, the coarse grid based on MODFLOW cannot accurately analyze the length of inclined fissures Lf on the grid. If the size of selected coarse grid is larger than the distance between two adjacent fissures, part of the two adjacent fissures will be merged in the grid, thereby shortening the actual flow path. Secondly, the length of inclined fissure Lf. is either overestimated or underestimated. The inaccurate analysis of flow paths will lead to an increase in the estimation error of flow rates and heads, especially in dense fissure zones near the center of the model domain. This effect can be greatly alleviated by refining the grid. The fissure dead-ends have non-negligible effects on MODFLOW grid flow. In this study, the MODFLOW-based FC model can be used to solve the pressure distributions between interconnected network of fissures and the rock matrix, overcoming the difficulty of determining water exchange between rock matrix and fissure media. This study can realize the expression of heterogeneity and anisotropy of fissure permeability in numerical computational units, which will promote the understanding of MODFLOW simulation of fissure flow based on connectivity. Furthermore, The size of the MODFLOW grid should be determined in combination with the size of the study area, which should be small enough to capture the detailed features in the flow, and large enough to reduce the computational time and cost. Generally, the grid size is determined by a trial algorithm. When FC approach is applied to the actual watershed, the spatial variability of topography and landform factors should also be considered, such as coupling surface elevation DEM data. -
Key words:
- DFN /
- connectivity /
- MODFLOW /
- seepage /
- fracture-continuum model
-
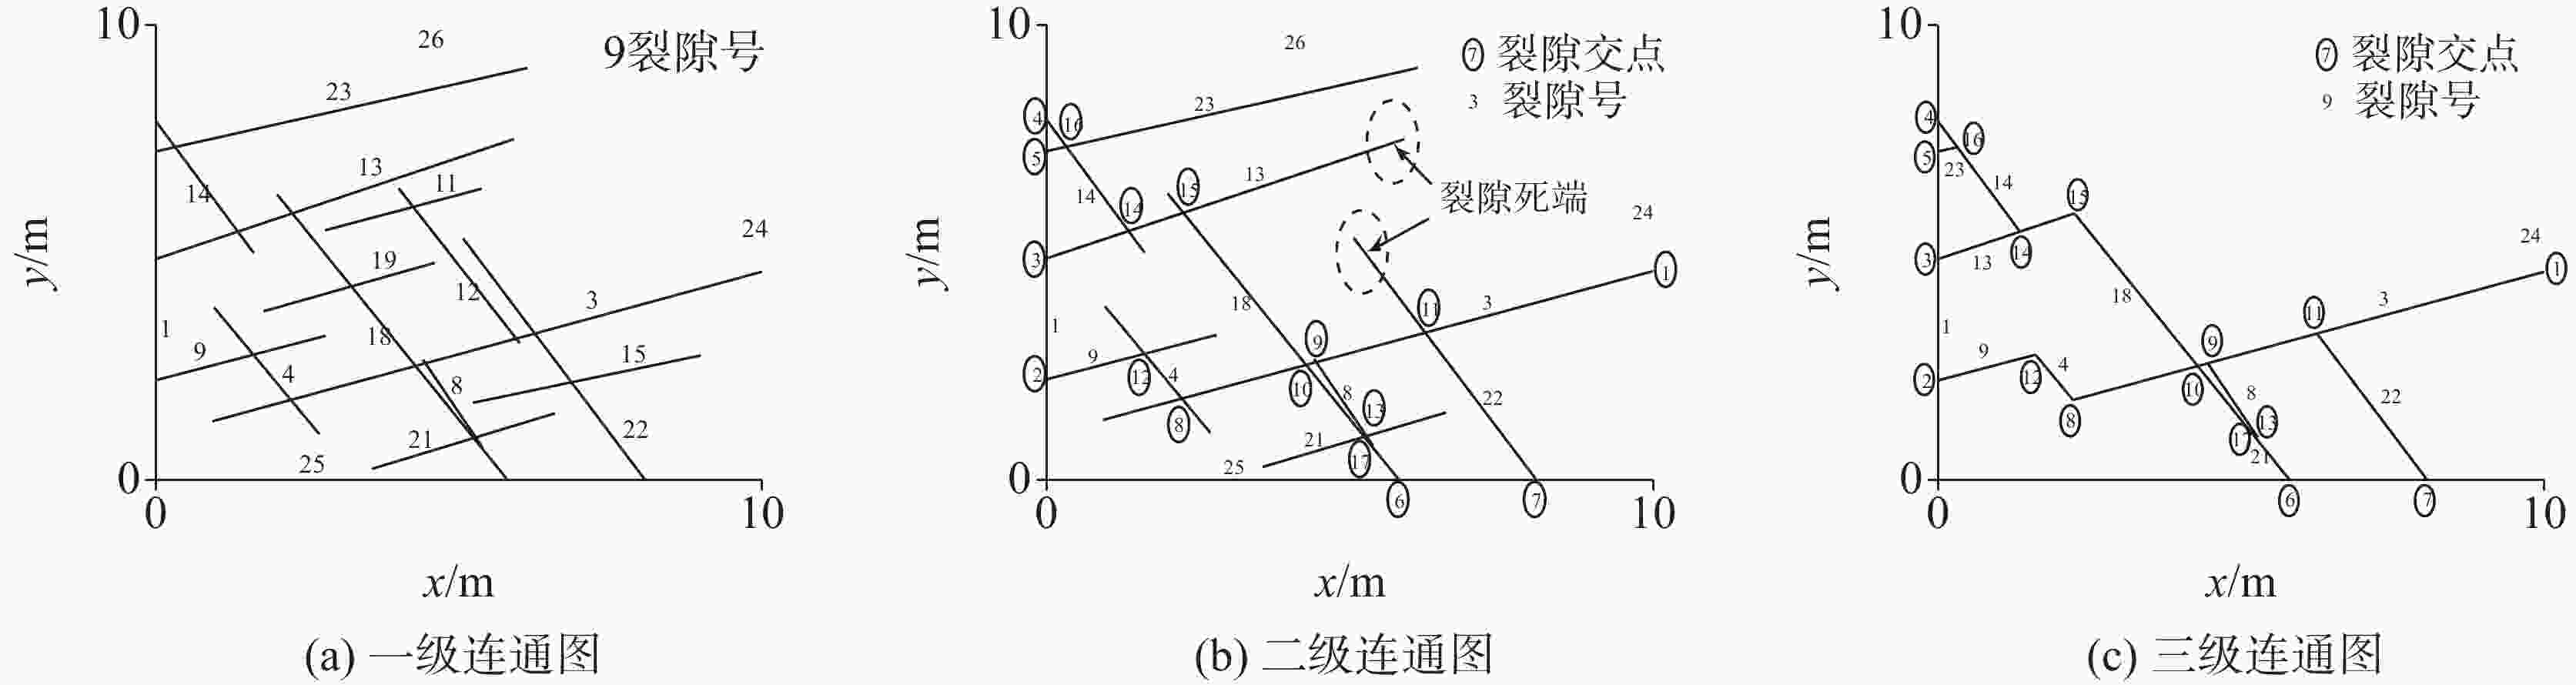
图 3 图2的连通图
Figure 3. Connectivity diagram of Fig. 2. (a) 1st- round cutting, (b) 2nd-round cutting, (c) 3rd -round cutting
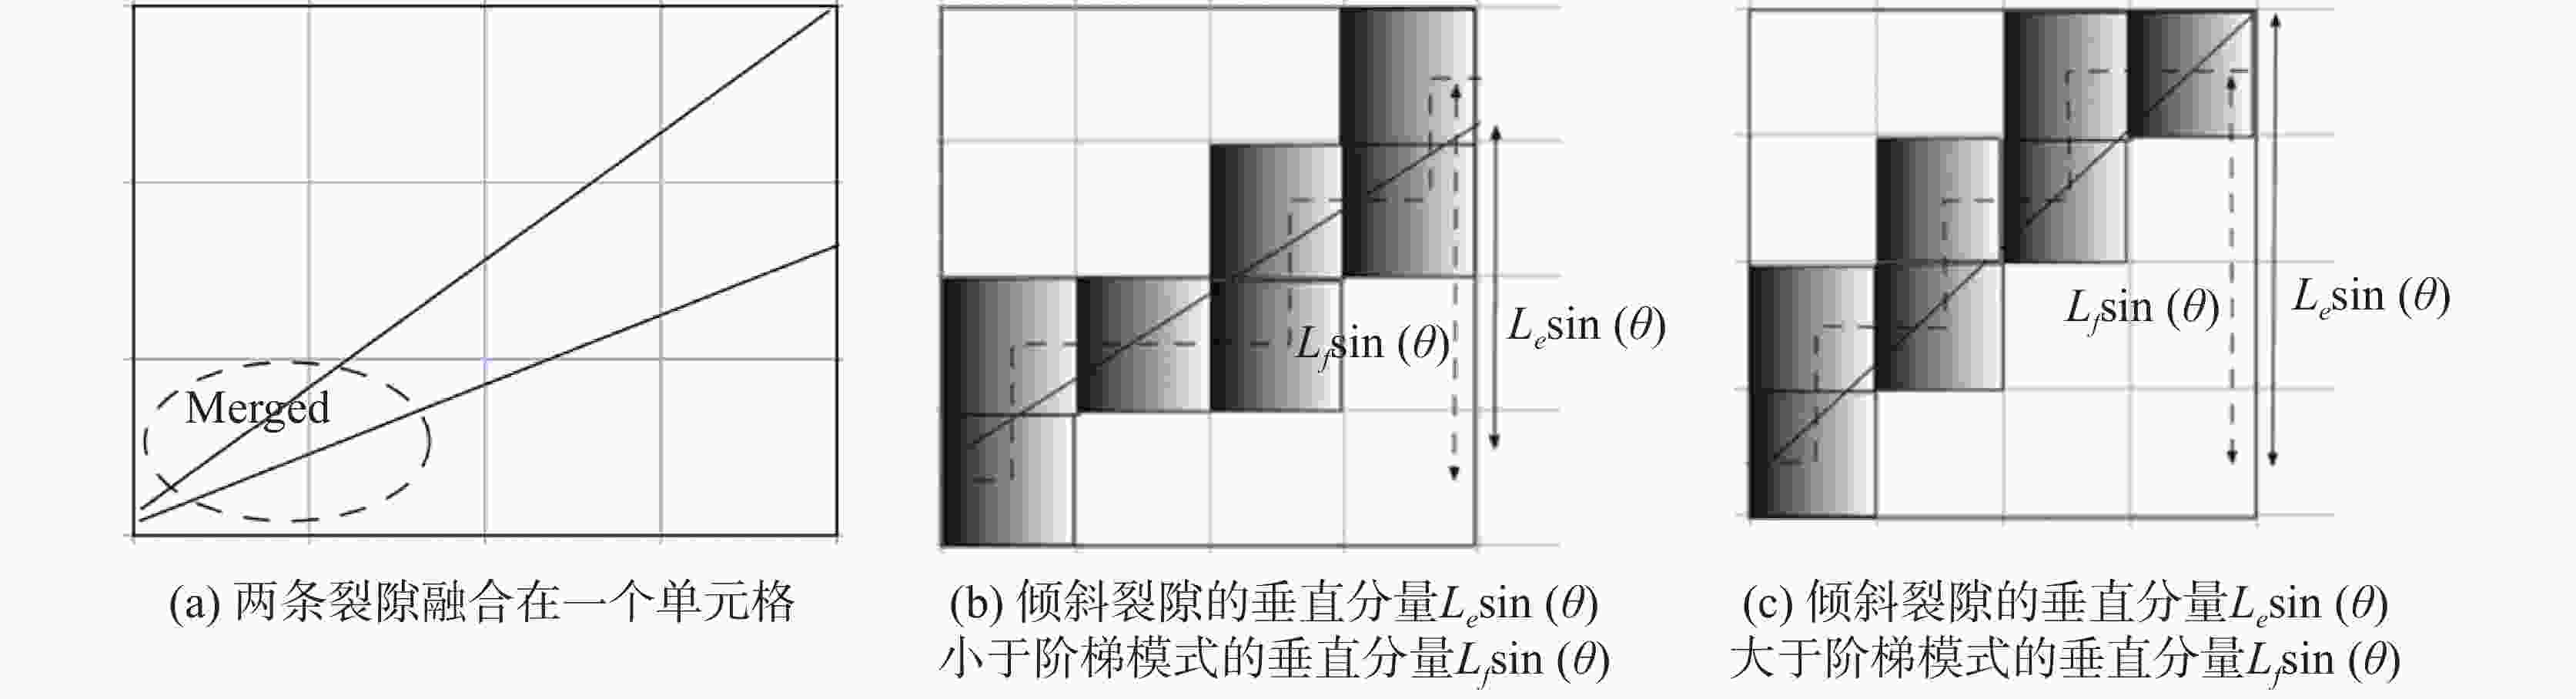
图 4 沿网格的流动路径示意图
(a) 两条裂隙融合在一个单元格;(b) 倾斜裂隙的垂直分量$ L_{e} \sin (\theta) $ 小于阶梯模式的垂直分量$ L_{f} \sin (\theta) $;(c) 倾斜裂隙的垂直分量$ L_{e} \sin (\theta) $大于阶梯模式的垂直分量$ L_{f} \sin (\theta) $
Figure 4. Sketch map of flow path along the grid
(a) mergence of two fractures within a grid, (b) actual vertical component of the inclined fracture $ L_{e} \sin (\theta) $ shorter than that of the ‘‘stair step’’ pattern $ L_{f} \sin (\theta) $, and (c) actual vertical component of the inclined fracture $ L_{e} \sin (\theta) $ longer than that of the ‘‘stair step’’ pattern $ L_{f} \sin (\theta) $
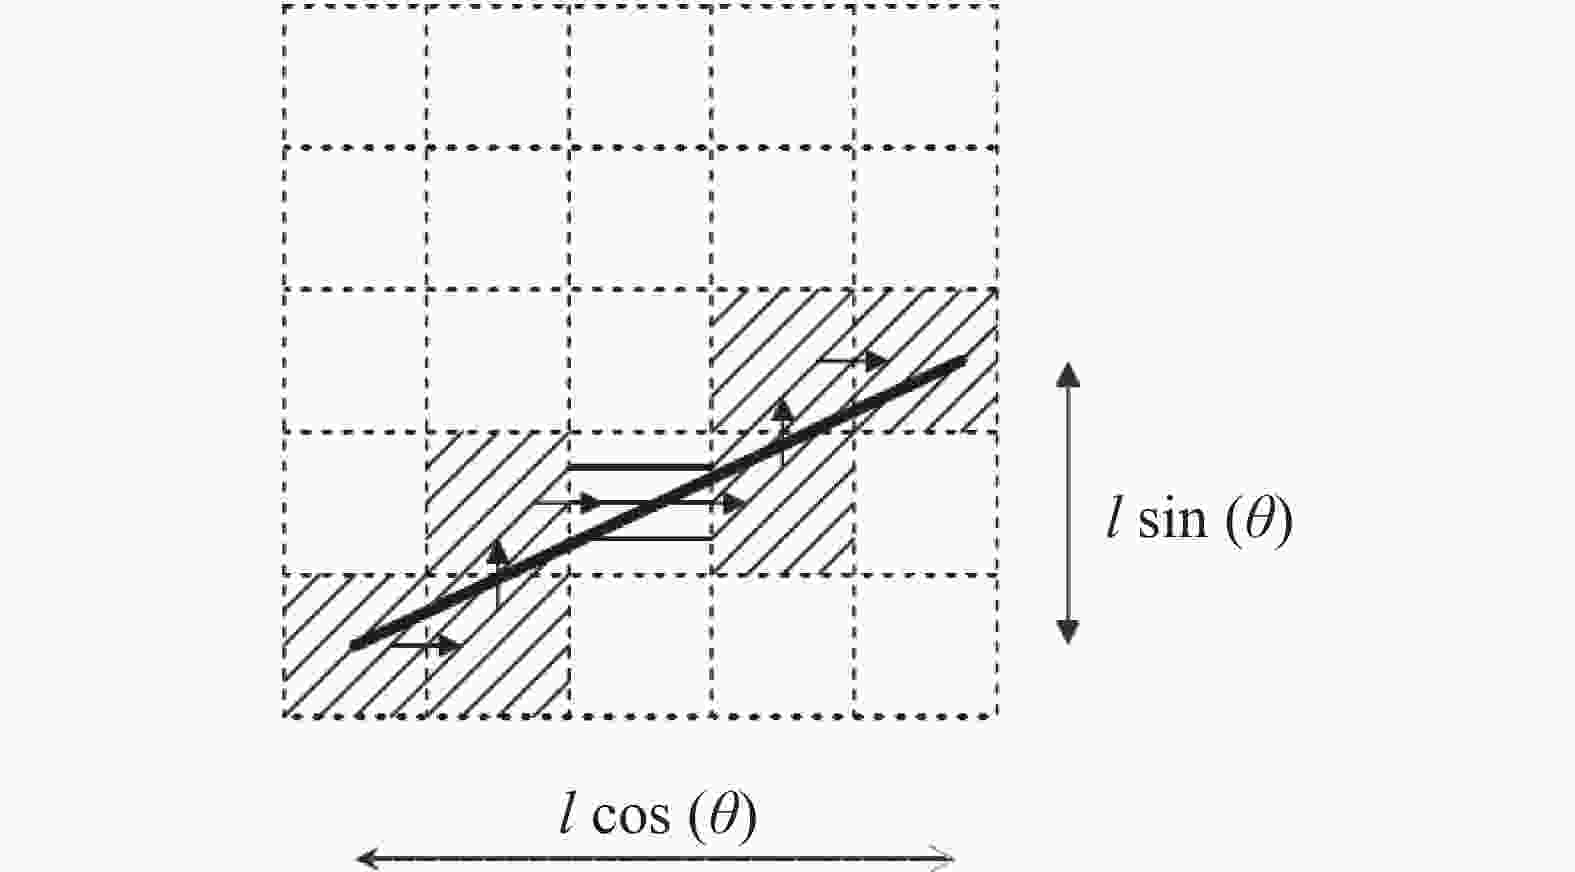
图 5 水平线、倾斜线分别表示I型、II型裂隙单元格
Figure 5. Flow path along the grid,the horizontal line represents fissure cell of Type I,and the inclined line represents fracture cells of Type II
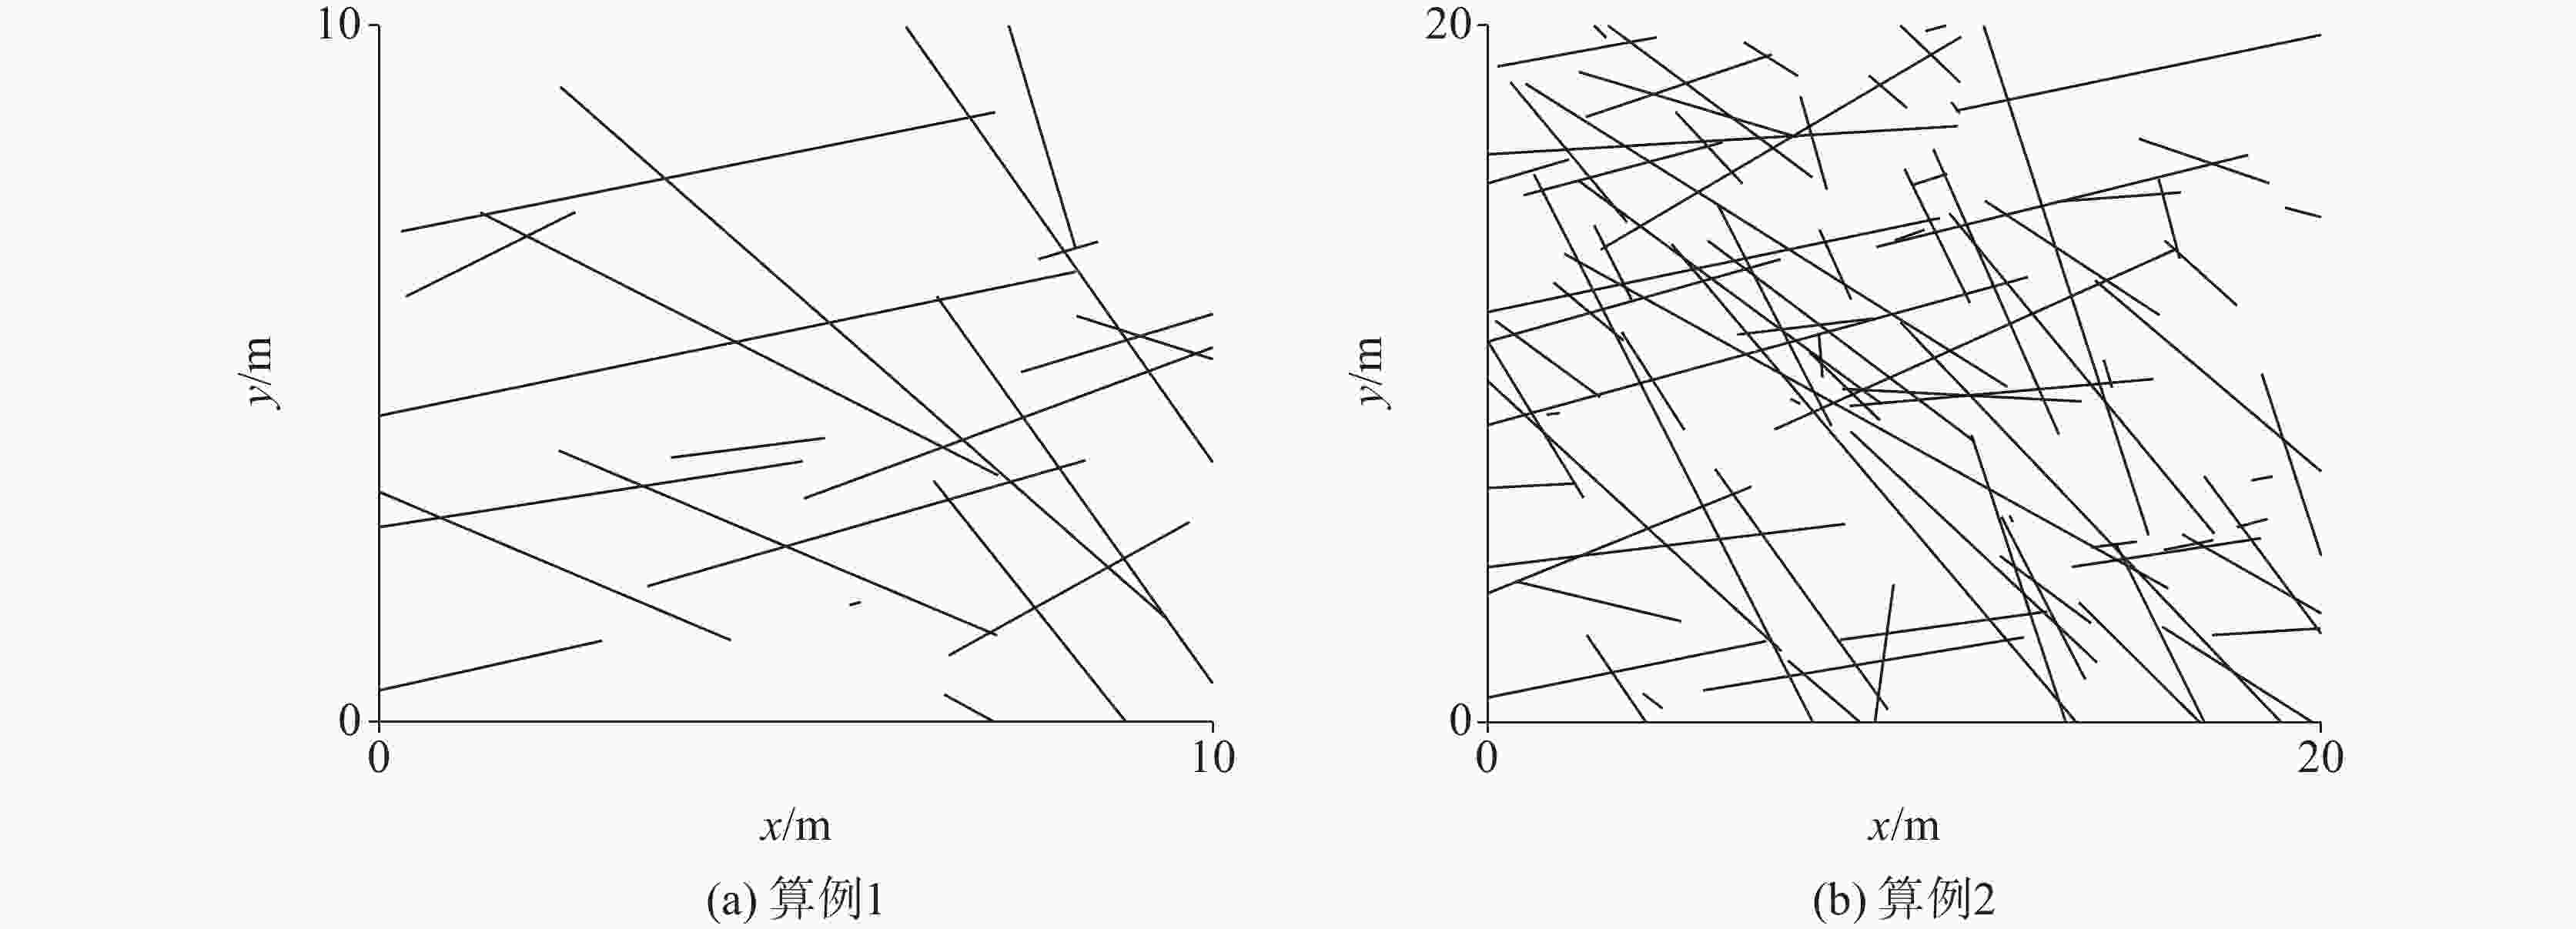
图 7 裂隙网络的某一次随机实现
Figure 7. Stochastic generation of fissure networks (one realizations for Case 1 (7a) and Case 2 (7b))
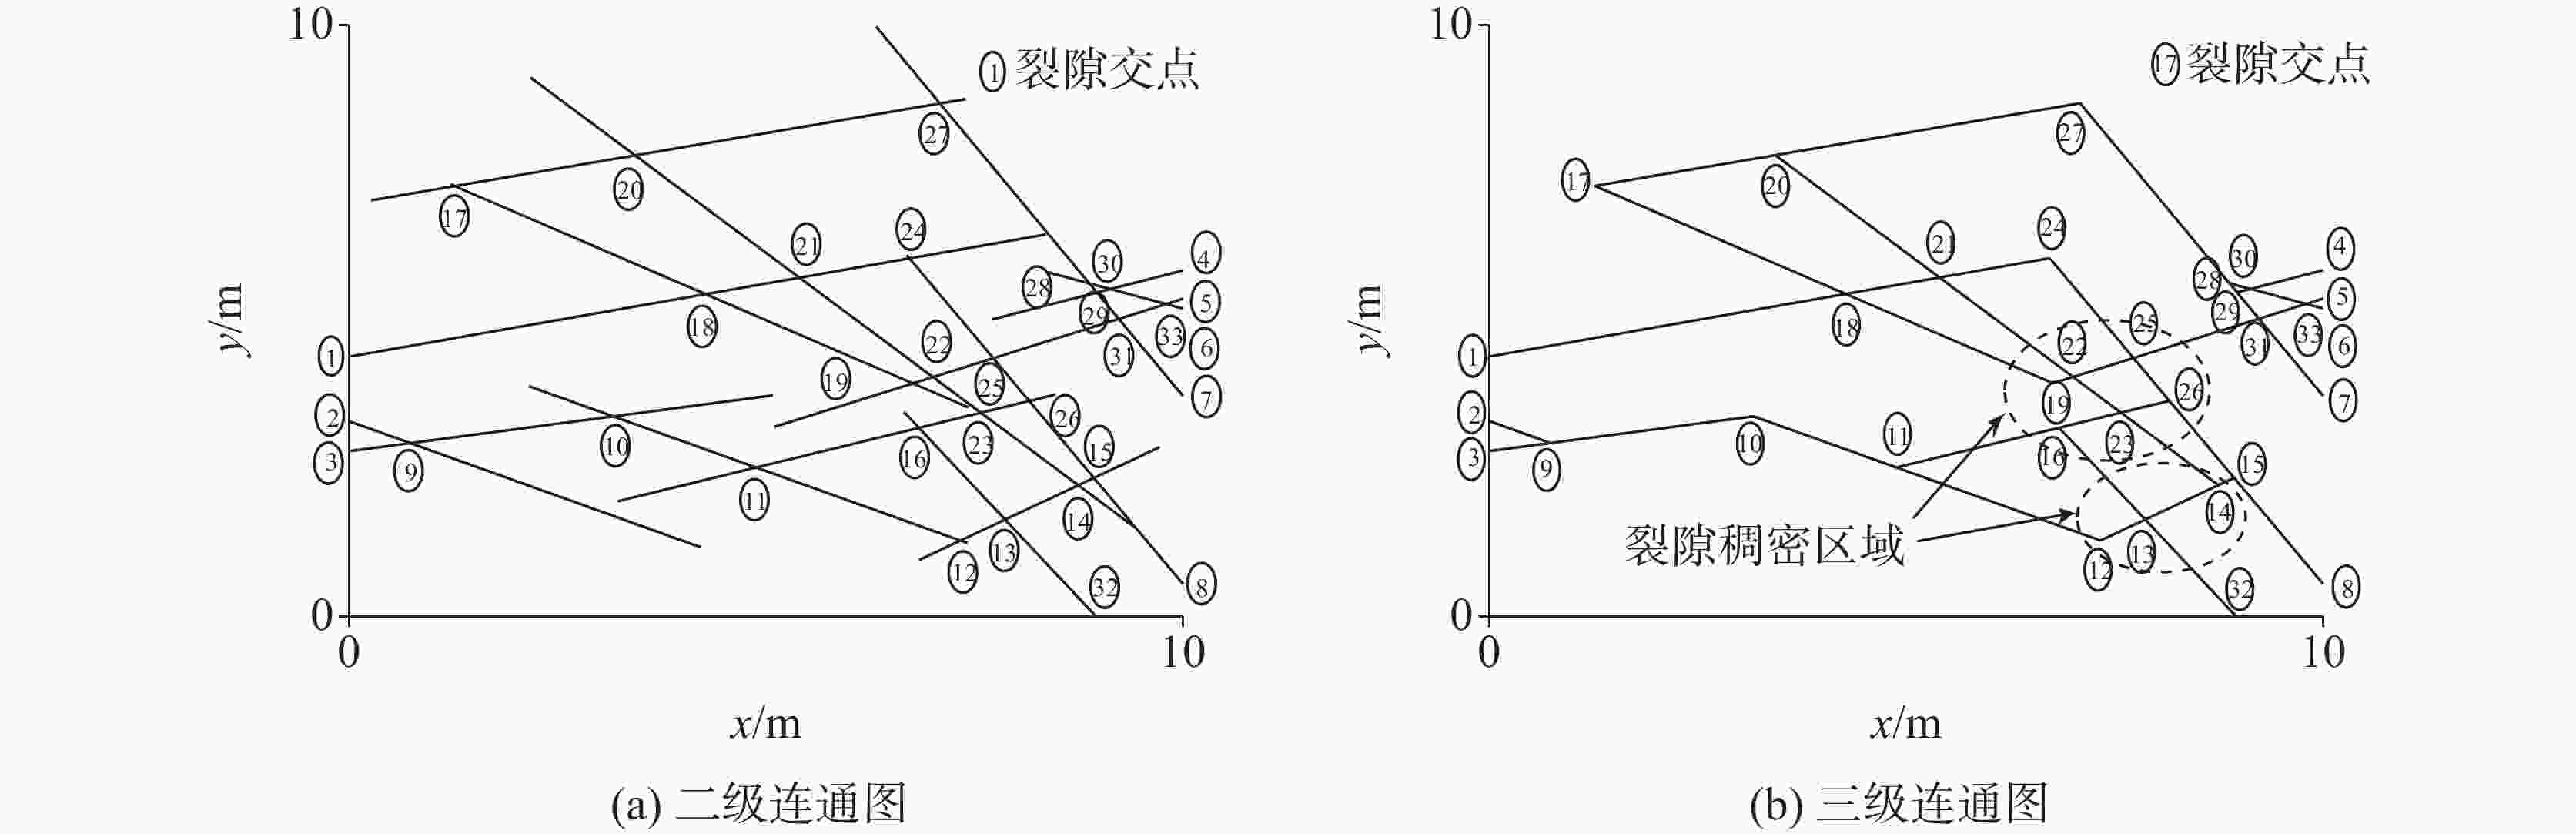
图 8 图7a的连通图(算例1)
Figure 8. Connectivity diagram of Fig. 7a for Case 1: (a) 2nd-round cutting;(b)3rd-round cutting
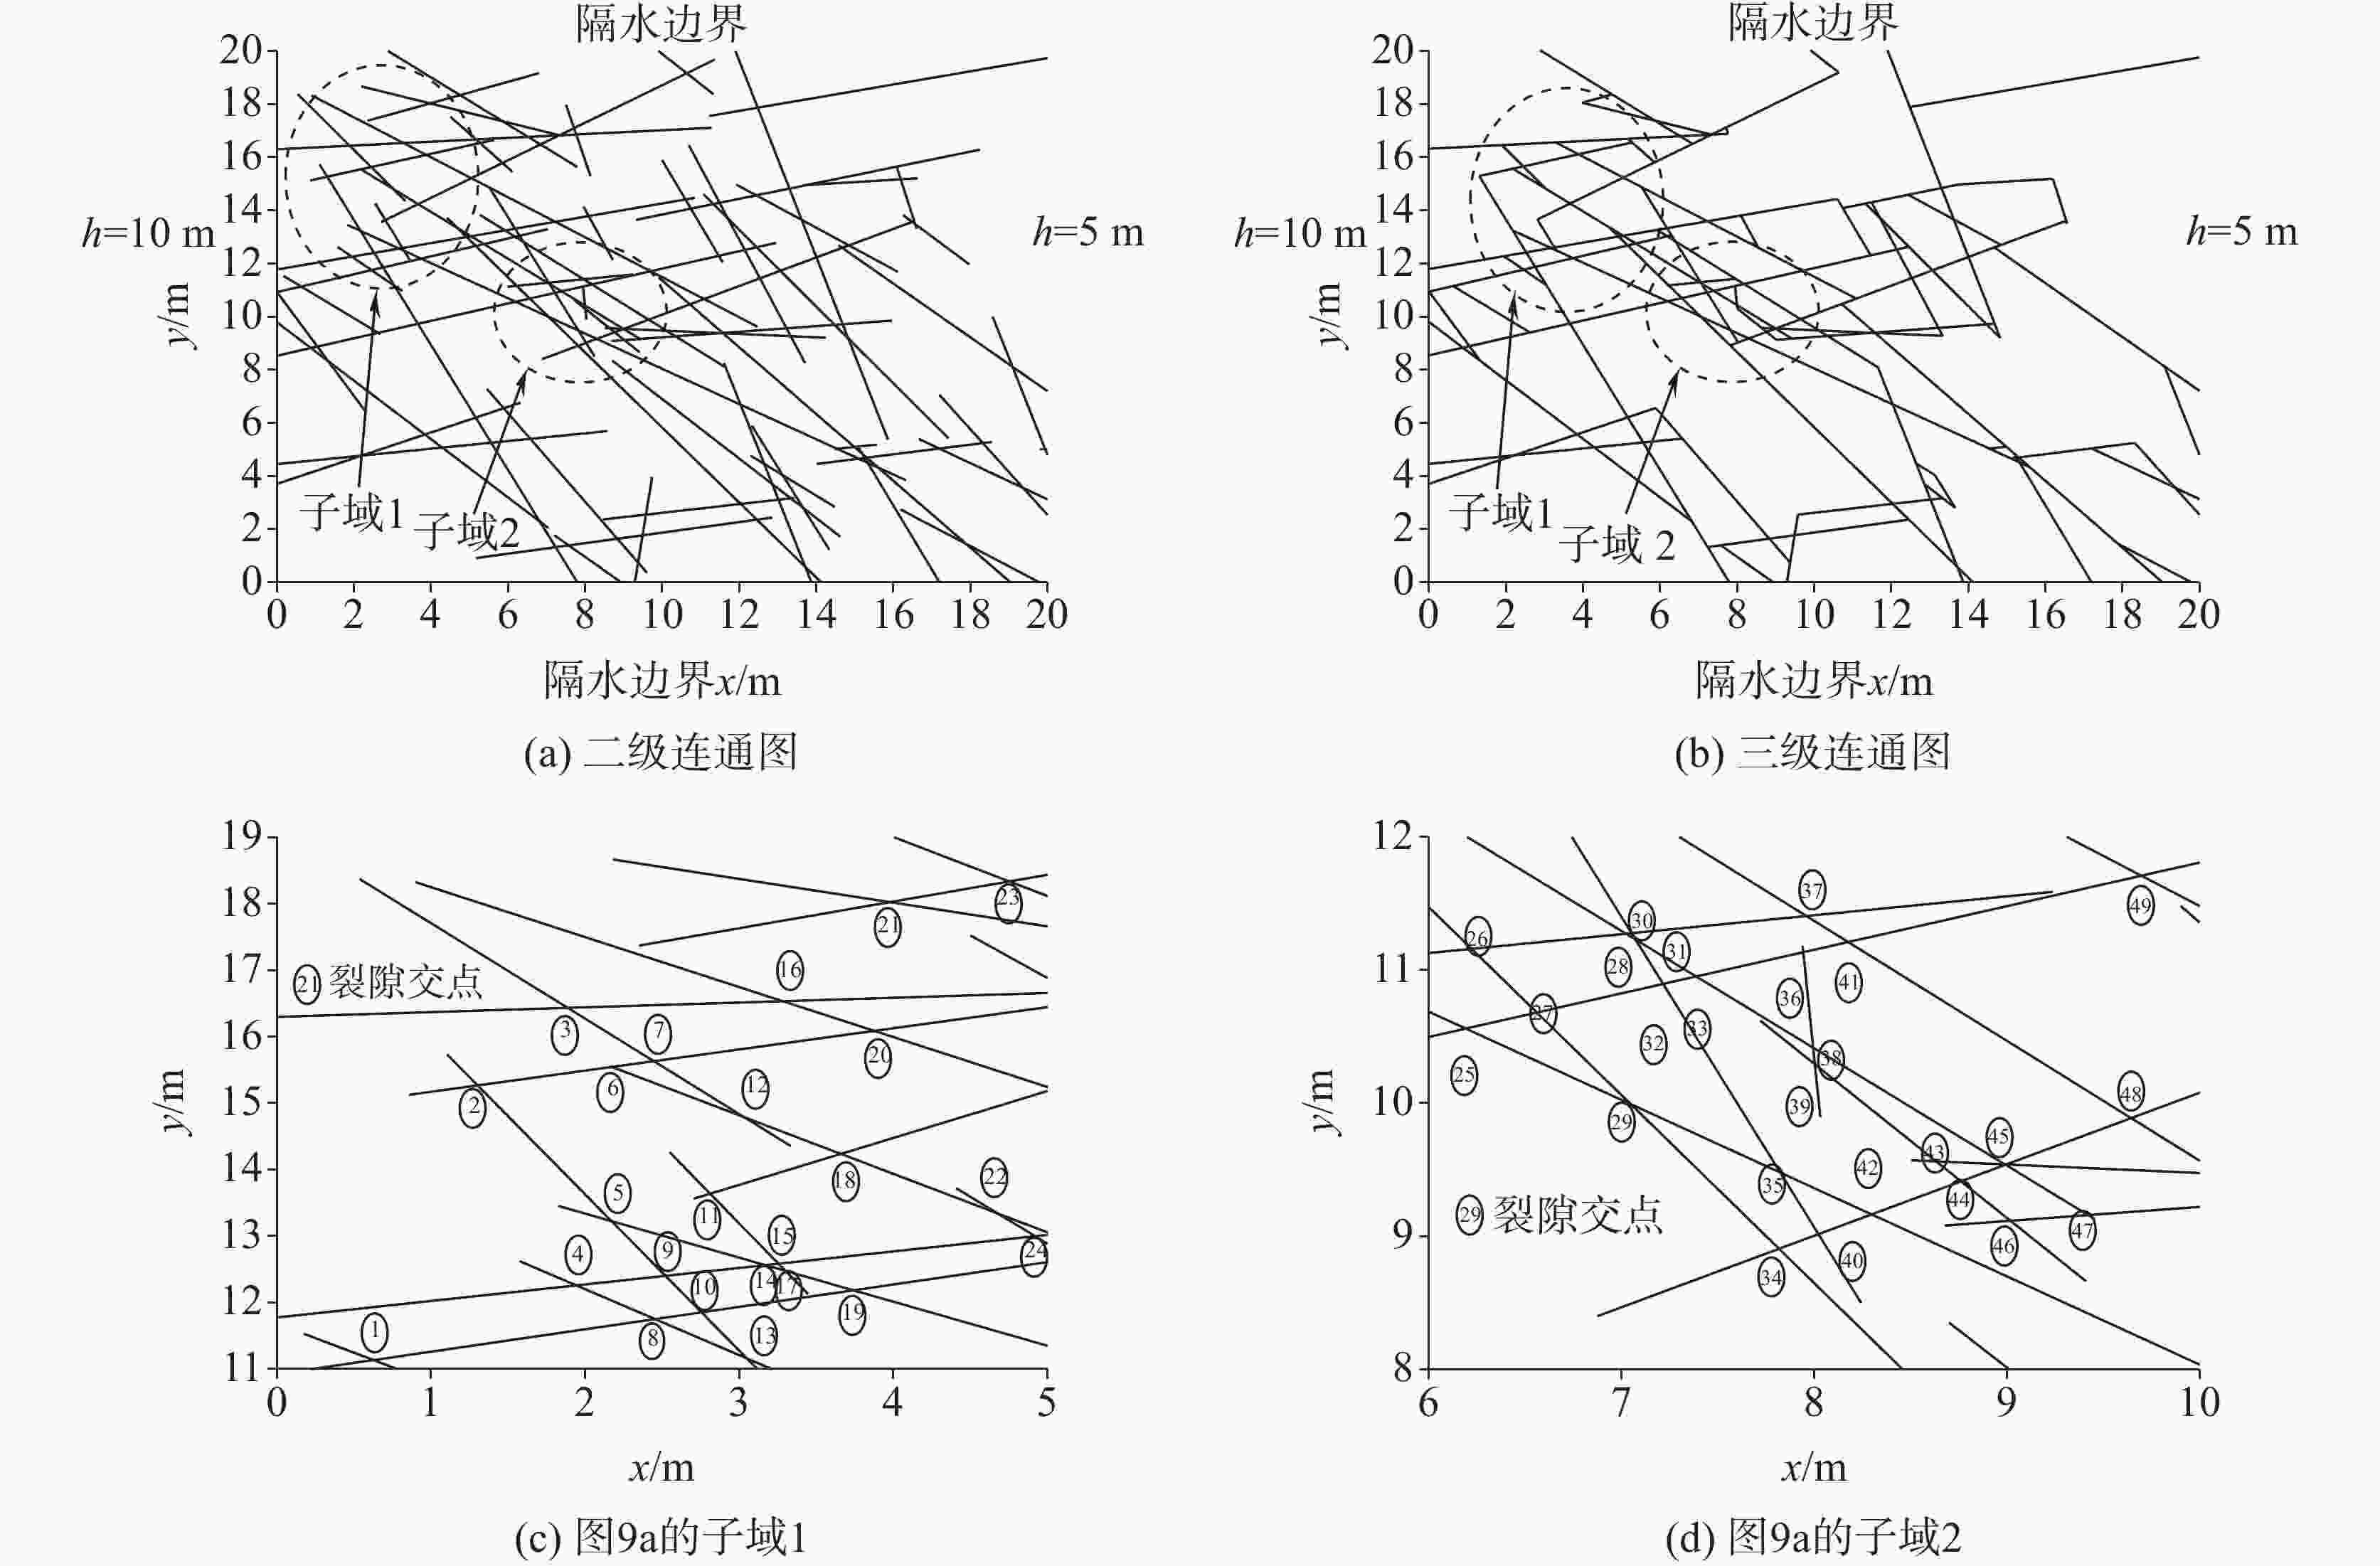
图 9 图7b的连通图(算例2)
Figure 9. Connectivity diagram of Fig. 7b for Case 2: (a) 2nd-round cutting; (b) 3rd -round cutting; (c) subdomain 1 for Fig. 9(a); (d) subdomain 2 for Fig. 9(a)
表 1 交叉流总流量的实测值、有限差分值、有限元值与理论值对比
Table 1. Comparison of measured values, finite difference values, finite element values, with theoretical values of cross flow
计算工况 精确解QDFN/cm2·s−1 Q实测/cm2·s−1 有限差分网格分辨率/cm QMOD/cm2·s−1 Q有限元/cm2·s−1 1 11.1792 11.6667 (4.36%)Δ=6.300 12.1960 (9.10%)11.1111 (0.61%)Δ=3.150 11.4499 (2.42%)2 5.2789 Δ=5.625 5.5743 (5.60%)Δ=4.500 5.3619 (1.57%) 下载: 导出CSV
表 2 交叉节点水头的有限差分值与理论值对比
Table 2. Comparison of finite difference values and theoretical values of intersection heads
计算工况 精确解HDFN/cm 有限差分网格分辨率/cm HMOD/cm 绝对误差/cm 1 39.219 Δ=6.300 39.193 −0.026 Δ=3.150 39.218 −0.001 2 8.066 Δ=5.625 8.088 0.022 Δ=4.500 8.049 −0.017
下载: 导出CSV
表 3 裂隙特征参数的统计分布(算例1)[22]
Table 3. Statistical distribution of characteristic parameters of fractures for Case 1[22]
裂隙组号 密度 方向 θ/° 迹长 l/ m 中心点
位置导水系数Tf/m2·s−1 N·m−2 分布 μ σ 分布 μ σ 分布 μ σ 分布 1 0.10 Poisson 15.0 8.0 正态 5.5 0.5 负指数 均匀分布 10−6 100.5 对数正态 2 0.10 Poisson 126.0 21.0 正态 6.5 0.5 负指数 均匀分布 10−6 100.5 对数正态
下载: 导出CSV
表 4 裂隙节点坐标和模拟水头(算例1,单位: m)
Table 4. Node coordinates and simulated heads by DFN and MODFLOW for Case 1 (Unit: m)
节点 ⑨ ⑩ ⑪ ⑫ ⑬ ⑭ ⑮ ⑯ ⑰ ⑱ ⑲ ⑳ ㉑ X 0.74 3.17 4.88 7.33 7.87 8.74 8.93 6.83 1.27 4.28 6.76 3.43 5.40 Y 2.93 3.38 2.52 1.28 1.64 2.22 2.34 3.19 7.28 5.45 3.94 7.80 5.73 HDFN 9.75 8.24 7.54 6.79 6.62 6.31 6.14 6.66 6.83 7.37 6.61 6.70 6.77 HMOD, 0.02 9.75 8.23 7.51 6.76 6.60 6.28 6.14 6.63 6.82 7.36 6.58 6.68 6.75 HMOD, 0.05 9.76 8.21 7.49 6.71 6.55 6.25 6.13 6.59 6.79 7.31 6.55 6.66 6.72 HMOD, 0.1 9.75 8.19 7.44 6.63 6.48 6.16 6.10 6.52 6.79 7.29 6.49 6.68 6.68 Err. HMOD, 0.02 0.00 −0.01 −0.03 −0.03 −0.02 −0.03 0.00 −0.03 −0.01 −0.01 −0.03 −0.02 −0.02 Err. HMOD, 0.05 0.01 −0.03 −0.05 −0.08 −0.07 −0.06 −0.01 −0.07 −0.04 −0.06 −0.06 −0.04 −0.05 Err. HMOD, 0.1 0.00 −0.05 −0.10 −0.16 −0.14 −0.15 −0.04 −0.14 −0.04 −0.08 −0.12 −0.02 −0.09 节点 ㉒ ㉓ ㉔ ㉕ ㉖ ㉗ ㉘ ㉙ ㉚ ㉛ ㉜ ㉝ X 7.00 7.58 6.72 7.72 8.16 7.08 8.88 8.97 9.13 9.23 8.96 9.79 Y 4.05 3.45 6.06 4.37 3.64 8.68 5.63 5.48 5.54 5.04 0.00 5.28 HDFN 6.54 6.47 6.58 6.32 6.28 5.88 5.08 5.07 5.06 5.14 6.62 5.02 HMOD, 0.02 6.52 6.44 6.57 6.31 6.27 5.88 5.08 5.07 5.06 5.14 6.60 5.02 HMOD, 0.05 6.49 6.41 6.54 6.29 6.25 5.87 5.07 5.07 5.06 5.13 6.55 5.02 HMOD, 0.1 6.43 6.35 6.50 6.24 6.22 5.86 5.08 5.07 5.06 5.12 6.48 5.01 Err. HMOD, 0.02 −0.02 −0.03 −0.01 −0.01 −0.01 0.00 0.00 0.00 0.00 0.00 −0.02 0.00 Err. HMOD, 0.05 −0.05 −0.06 −0.04 −0.03 −0.03 −0.01 −0.01 0.00 0.00 −0.01 −0.07 0.00 Err. HMOD, 0.1 −0.11 −0.12 −0.08 −0.08 −0.06 −0.02 0.00 0.00 0.00 −0.02 −0.14 −0.01
下载: 导出CSV
表 5 裂隙节点坐标和模拟水头(算例2,单位: m,部分节点)
Table 5. Node coordinates and simulated heads by DFN and MODFLOW for Case 2 (Unit: m,partial nodes )
节点 ⑭ ⑮ ⑯ ⑰ ⑱ ⑲ ⑳ ㉑ ㉒ ㉓ ㉔ ㉕ ㉖ X 3.17 3.25 3.28 3.30 3.66 3.74 3.88 3.98 4.68 4.75 5.03 6.19 6.22 Y 12.56 12.58 16.53 12.48 14.24 12.18 16.09 18.02 13.34 18.34 13.03 10.56 11.16 HDFN 8.88 8.86 8.78 8.86 8.64 8.83 8.71 8.65 8.58 8.65 8.55 8.55 8.42 HMOD, 0.04 8.87 8.86 8.77 8.87 8.64 8.83 8.70 8.64 8.58 8.64 8.55 8.55 8.42 HMOD, 0.1 8.90 8.89 8.80 8.88 8.68 8.86 8.73 8.67 8.60 8.67 8.58 8.57 8.44 HMOD, 0.2 8.94 8.93 8.85 8.93 8.75 8.90 8.80 8.74 8.67 8.74 8.65 8.60 8.55 Err. HMOD, 0.04 −0.01 0.00 −0.01 0.01 0.00 0.00 −0.01 −0.01 0.00 −0.01 0.00 0.00 0.00 Err. HMOD, 0.1 0.02 0.03 0.02 0.02 0.04 0.03 0.02 0.02 0.02 0.02 0.03 0.02 0.02 Err. HMOD, 0.2 0.06 0.07 0.07 0.07 0.11 0.07 0.09 0.09 0.09 0.09 0.10 0.05 0.13 节点 ㉗ ㉘ ㉙ ㉚ ㉛ ㉜ ㉝ ㉞ ㉟ ㊱ ㊲ ㊳ ㊴ X 6.56 7.02 7.05 7.05 7.07 7.22 7.39 7.82 7.82 7.94 7.96 7.99 8.00 Y 10.68 11.27 9.99 11.28 11.23 10.90 10.95 8.91 9.48 11.13 11.41 10.42 10.29 HDFN 8.46 8.38 8.40 8.38 8.38 8.37 8.35 8.26 8.28 8.30 8.33 8.29 8.29 HMOD, 0.04 8.47 8.38 8.39 8.38 8.38 8.36 8.35 8.26 8.28 8.30 8.34 8.29 8.29 HMOD, 0.1 8.49 8.40 8.41 8.40 8.40 8.39 8.38 8.28 8.30 8.33 8.36 8.32 8.31 HMOD, 0.2 8.55 8.49 8.44 8.49 8.49 8.47 8.47 8.35 8.37 8.44 8.45 8.42 8.41 Err. HMOD, 0.04 0.01 0.00 −0.01 0.00 0.00 −0.01 0.00 0.00 0.00 0.00 0.01 0.00 0.00 Err. HMOD, 0.1 0.03 0.02 0.01 0.02 0.02 0.02 0.03 0.02 0.02 0.03 0.03 0.03 0.02 Err. HMOD, 0.2 0.09 0.11 0.04 0.11 0.11 0.10 0.12 0.09 0.09 0.14 0.12 0.13 0.12
下载: 导出CSV
表 6 MODFLOW网格倾斜长度、阶梯长度与DFN流动路径对比(算例1,单位: m,部分节点)(括号里的值表示Lf和Le的误差)
Table 6. Comparison of MODFLOW inclined fissure length, stair step length and DFN flow path (Case 1, Unit: m,partial nodes) (The bracket value indicates error between Lf and Le)
节点 DFN 倾斜裂隙长度 阶梯长度 Le 粗网格
Lf (0.10 m)细网格
Lf (0.05 m)精细网格
Lf (0.02 m)粗网格
Lg (0.10 m)细网格
Lg (0.05 m)精细网格
Lg (0.02 m)㉙-㉛ 0.52 0.50(−0.02) 0.51(−0.01) 0.53(+0.01) 0.70 0.70 0.72 ㉛-⑦ 1.52 1.48(−0.04) 1.50(−0.02) 1.51(−0.01) 2.00 2.05 2.06 ㉛-㉝ 0.62 0.54(−0.08) 0.60(−0.02) 0.62 0.70 0.80 0.82 ㉝-⑤ 0.22 0.22 0.22 0.22 0.30 0.30 0.28 ㉝-⑥ 0.22 0.20(−0.02) 0.21(−0.01) 0.22 0.20 0.25 0.28 ㉚-④ 0.93 0.85(−0.08) 0.92(−0.01) 0.92(−0.01) 1.10 1.20 1.18 ㉚-㉝ 0.71 0.67(−0.04) 0.70(−0.01) 0.70(−0.01) 0.90 0.90 0.90 ㉒-㉕ 0.79 0.76(−0.03) 0.78(−0.01) 0.79 1.00 1.05 1.04 ㉕-㉖ 0.84 0.81(−0.03) 0.87(+0.03) 0.83(−0.01) 1.10 1.20 1.14 ㉕-㉛ 1.64 1.66(+0.02) 1.63(−0.01) 1.64 2.20 2.15 2.16 ㉖-⑮ 1.52 1.53(+0.01) 1.50(−0.02) 1.52 2.10 2.05 2.08 ⑪-⑯ 2.06 2.09(+0.03) 2.06 2.06 2.60 2.60 2.62 ⑪-⑫ 2.74 2.82(+0.08) 2.75(+0.01) 2.73(−0.01) 3.80 3.70 3.66 ⑯-㉓ 0.78 0.76(−0.02) 0.79(+0.01) 0.78 1.00 1.00 1.00 ⑯-⑬ 1.86 1.80(−0.06) 1.87(+0.01) 1.87(+0.01) 2.50 2.60 2.60 ⑫-⑬ 0.64 0.64 0.65(+0.01) 0.64 0.90 0.90 0.88 ㉓-⑭ 1.69 1.70(+0.01) 1.66(−0.03) 1.71(+0.02) 2.40 2.35 2.42 ⑬-⑭ 1.05 1.08(+0.03) 1.04(−0.01) 1.05 1.50 1.45 1.46 ㉓-㉖ 0.61 0.63(+0.02) 0.63(+0.02) 0.61 0.80 0.80 0.78 ⑲-㉒ 0.26 0.32(+0.06) 0.27(+0.01) 0.26 0.40 0.35 0.34 ㉒-㉓ 0.83 0.78(−0.05) 0.81(−0.02) 0.82(−0.01) 1.10 1.15 1.16 ⑯-㉓ 0.78 0.76(−0.02) 0.79(+0.01) 0.78 1.00 1.00 1.00 ⑭-⑮ 0.22 0.22 0.22 0.23(+0.01) 0.30 0.30 0.32 ㉘-㉙ 0.18 0.22(+0.04) 0.18 0.17(−0.01) 0.30 0.25 0.24 ㉙-㉚ 0.17 0.22(+0.05) 0.16(−0.01) 0.16(−0.01) 0.30 0.20 0.20 ㉘-㉚ 0.27 0.32(+0.05) 0.27 0.28(+0.01) 0.40 0.35 0.36
下载: 导出CSV
表 7 MODFLOW网格倾斜长度、阶梯长度与DFN流动路径对比(算例2,单位: m,部分节点)(括号里的值表示Lf和Le的误差)
Table 7. Comparison of MODFLOW inclined fissure length, stair step length and DFN flow path (Case 2, Unit: m,partial nodes) (The bracket value indicates the error between Lf and Le)
节点 DFN 倾斜裂隙长度 阶梯长度 Le 粗网格
Lf (0.20 m)细网格
Lf (0.10 m)精细网格
Lf (0.04 m)粗网格
Lg (0.20 m)细网格
Lg (0.10 m)精细网格
Lg (0.04 m)⑤-⑨ 0.89 0.89 0.89 0.88(−0.01) 1.20 1.20 1.16 ⑤-⑭ 1.20 1.28(+0.08) 1.22(+0.02) 1.19(−0.01) 1.80 1.70 1.64 ⑨-④ 0.60 0.63(+0.03) 0.63(+0.03) 0.62(+0.02) 0.80 0.80 0.76 ⑨-⑩ 0.60 0.63(+0.03) 0.63(+0.03) 0.59(−0.01) 0.80 0.80 0.76 ⑨-⑭ 0.67 0.60(−0.07) 0.61(−0.06) 0.66(−0.01) 0.60 0.70 0.80 ④-⑧ 0.72 0.85(+0.13) 0.71(−0.01) 0.74(+0.02) 1.20 1.00 1.04 ⑲-⑰ 0.53 0.57(+0.04) 0.58(+0.05) 0.52(−0.01) 0.80 0.80 0.72 ⑭-⑮ 0.08 0.20(+0.12) 0.10(+0.02) 0.08 0.20 0.10 0.08 ⑭-⑰ 0.15 0.20(+0.05) 0.14(−0.01) 0.17(+0.02) 0.20 0.20 0.24 ⑰-⑮ 0.11 0.00(−0.11) 0.10(−0.01) 0.13(+0.02) 0.00 0.10 0.16 ㉘-㉛ 0.06 0.00(−0.06) 0.00(−0.06) 0.06 0.00 0.00 0.08 ㉘-㉚ 0.03 0.00(−0.03) 0.00(−0.03) 0.04(+0.01) 0.00 0.00 0.04 ㉚-㉛ 0.05 0.00(−0.05) 0.00(−0.05) 0.04(−0.01) 0.00 0.00 0.04 ㉛-㉜ 0.36 0.45(+0.09) 0.45(+0.09) 0.36 0.60 0.60 0.48 ㉛-㉝ 0.43 0.45(+0.02) 0.42(−0.01) 0.43 0.60 0.60 0.60 ㉜-㉝ 0.18 0.00(−0.18) 0.14(−0.04) 0.16(−0.02) 0.00 0.20 0.20 ㉜-㉟ 1.54 1.52(−0.02) 1.52(−0.02) 1.56(0.02) 2.00 2.00 2.04 ㉝-㊱ 0.58 0.63(+0.05) 0.63(+0.05) 0.59(+0.01) 0.80 0.80 0.76 ㉝-㊳ 0.80 0.72(−0.08) 0.78(−0.02) 0.79(−0.01) 1.00 1.10 1.12 ㉙-㉞ 1.33 1.28(−0.05) 1.28(−0.05) 1.32(−0.01) 1.80 1.80 1.84 ㉙-㉟ 0.92 0.89(−0.03) 0.94(+0.02) 0.92 1.20 1.30 1.28
下载: 导出CSV
-
[1] WILLIMAS P W. The role of the epikarst in karst and cave hydrogeology: a review[J]. International Journal of Speleology, 2008, 37(1): 1-10. doi: 10.5038/1827-806X.37.1.1 [2] 陈喜, 张志才. 喀斯特地区地球关键带科学与生态水文学发展综述[J]. 中国岩溶, 2022, 41(3):356-364.CHEN Xi, ZHANG Zhicai. An overview on the development of science and ecological hydrology of the earth critical zones in karst area[J]. Carsologica Sinica, 2022, 41(3): 356-364. [3] 张君, 陈洪松, 聂云鹏, 付智勇, 连晋姣, 王发, 罗紫东, 王克林. 西南喀斯特关键带结构及其水文过程研究进展[J]. 应用生态学报, 2024, 35(4):985-996.ZHANG Jun, CHEN Hongsong, NIE Yunpeng, FU Zhiyong, LIAN Jinjiao, WANG Fa, LUO Zidong, Wang Kelin. Research progress on structure and hydrological processes in the karst critical zone, southwest China[J]. Chinese Journal of Applied Ecology, 2024, 35(4): 985-996. [4] 蒋忠诚. 中国南方表层岩溶带的特征及形成机理[J]. 热带地理, 1998, 18(4):322-326. doi: 10.3969/j.issn.1001-5221.1998.04.007JIANG Zhongcheng. Features of epikarst zone south China and formation mechanism[J]. Tropical Geography, 1998, 18(4): 322-326. doi: 10.3969/j.issn.1001-5221.1998.04.007 [5] 刘晓丽, 王恩志, 王思敬, 樊赟赟. 裂隙岩体表征方法及岩体水力学特性研究[J]. 岩石力学与工程学报, 2008, 27(9):1814-1821. doi: 10.3321/j.issn:1000-6915.2008.09.008LIU Xiaoli, WANG Enzhi, WANG Sijing, FAN Yunyun. Representation method of fractured rock mass and its hydraulic properties study[J]. Chinese Journal of Rock Mechanics and Engineering, 2008, 27(9): 1814-1821. doi: 10.3321/j.issn:1000-6915.2008.09.008 [6] YE Zuyang, FAN Xincheng, ZHANG Jun, SHENG Jianlong, CHEN Yuting, FAN Qingli, QIN Huikai. Evaluation of connectivity characteristics on the permeability of two-dimensional fracture networks using geological entropy[J]. Water Resources Research, 2021, 57(10): 1-16. [7] HU Mengsu, RUTQVIST J, WANG Yuan. A practical model for fluid flow in discrete-fracture porous media by using the numerical manifold method[J]. Advances in Water Resources, 2016, 97: 38-51. doi: 10.1016/j.advwatres.2016.09.001 [8] 罗明明, 尹德超, 张亮, 陈植华, 周宏, 韩兆丰, 史婷婷. 南方岩溶含水系统结构识别方法初探[J]. 中国岩溶, 2015, 34(6):543-550.LUO Mingming, YIN Dechao, ZHANG Liang, CHEN Zhihua, ZHOU Hong, HAN Zhaofeng, SHI Tingting. Identifying methods of karst aquifer system structure in South China[J]. Carsologica Sinica, 2015, 34(6): 543-550. [9] 徐中平, 周训, 崔相飞, 拓明明, 王昕昀, 张颖. 岩溶区地下水数值模拟研究进展[J]. 中国岩溶, 2018, 37(4):475-483.XU Zhongping, ZHOU Xun, CUI Xiangfei, TA Mingming, WANG Xinyun, ZHANG Ying. Research advances of numerical simulation of groundwater in karst areas[J]. Carsologica Sinica, 2018, 37(4): 475-483. [10] 常勇. 裂隙-管道二元结构的岩溶泉水文过程分析与模拟[D]. 南京: 南京大学, 2015.CHANG Yong. Analysis and simulation of the hydrological process of the karst aquifer with fracture-conduit dual structure [D]. Nanjing: Nanjing University, 2015. [11] 党志文, 邵景力, 崔亚莉, 李军, 宫志强, 赵良杰, 梁永升. 基于MODFLOW-CFP的贵州大井流域岩溶地下水数值模拟[J]. 中国岩溶, 2023, 42(2):266-276.DANG Zhiwen, SHAO Jingli, CUI Yali, LI Jun, GONG Zhiqiang, ZHAO Liangjie, LIANG Yongsheng. Numerical simulation of karst groundwater in Dajing basin of Guizhou Province based on MODFLOW-CFP[J]. Carsologica Sinica, 2023, 42(2): 266-276. [12] 赵良杰, 夏日元, 杨杨, 邵景力, 易连兴, 王喆. 基于MODFLOW的岩溶管道水流模拟方法探讨与应用[J]. 中国岩溶, 2017, 36(3):346-351.ZHAO Liangjie, XIA Riyuan, YANG Yang, SHAO Jingli, YI Lianxing, WANG Zhe. Discussion and application of simulation methods for karst conduit flow based on MODFLOW[J]. Carsologica Sinica, 2017, 36(3): 346-351. [13] 王晋丽, 陈喜, 黄远洋, 张志才. 岩体裂隙网络随机生成及连通性研究[J]. 水文地质工程地质, 2013, 40(2):30-35.WANG Jinli, CHEN Xi, HUANG Yuanyang, ZHANG Zhicai. A study of stochastic generation and connectivity of fracture network in rock mass[J]. Hydrogeology & Engineering Geology, 2013, 40(2): 30-35. [14] BOTROS F E, HASSAN A E, REEVES D M, POHLL G. On mapping fracture networks onto continuum[J]. Water Resources Research, 2008, 44,W08435: 1-17. [15] 王晋丽, 陈喜, 常彦伟, 张志才, 康建荣, 程勤波. 基于裂隙网络连通性的裂隙流的MODFLOW模拟方法, CN108399290B[P]. 2021-07-06.WANG Jinli, CHEN Xi, CHANG Yanwei, ZHANG Zhicai, KANG Jianrong, CHENG Qinbo. MODFLOW simulation method for fracture flow based on fracture network connectivity, CN108399290B[P]. 2021-07-06. [16] 方涛, 柴军瑞, 胡海浪, 徐文彬. Monte Carlo方法在岩体裂隙结构面模拟中的应用[J]. 露天采矿技术, 2007(1):7-9+13. doi: 10.3969/j.issn.1671-9816.2007.01.003FANG Tao, CHAI Junrui, HU Hailang, XU Wenbin. Application of Monte Carlo method to simulating the fracture interconnectivity of rock mass[J]. Surface Mining Technology, 2007(1): 7-9+13. doi: 10.3969/j.issn.1671-9816.2007.01.003 [17] LONG J C S, BILLAUX D M. From field data to fracture network modeling: An example incorporating spatial structure[J]. Water Resources Research, 1987, 23(7): 1201-1216. doi: 10.1029/WR023i007p01201 [18] 王晋丽, 陈喜, 常彦伟, 张志才, 康建荣. 一种基于图论的裂隙网络连通性及渗流计算的方法[P], 公告号:CN106991244B.申请(专利)号:CN201710240011.0, 2019-06-28.WANG Jinli, CHEN Xi, CHANG Yanwei, ZHANG Zhicai, KANG Jianrong. A method based on graph theory for fracture network connectivity and seepage calculating[P], CN106991244B. 2019-06-28. [19] BERKOWITZ B. Analysis of fracture network connectivity using percolation theory[J]. Mathematical Geology, 1995, 27(4): 467-483. doi: 10.1007/BF02084422 [20] SNOW D T. Anisotropie permeability of fractured media[J]. Water Resources Research, 1969, 5(6): 1273-1289. doi: 10.1029/WR005i006p01273 [21] PRIEST S D. Discontinuity analysis for rock engineering [M]. London: Chapman and Hall, 1993. [22] 王晋丽, 陈喜, 张志才, 康建荣, 高满. 基于离散裂隙网络模型的裂隙水渗流计算[J]. 中国岩溶, 2016, 35(4):363-371.WANG Jinli, CHEN Xi, ZHANG Zhicai, KANG Jianrong, GAO Man. Computation of fracture water flow based on discrete fracture network model[J]. Carsologica Sinica, 2016, 35(4): 363-371. [23] REEVES D M, BENSON D A, MEERSCHAERT M M. Transport of conservative solutes in simulated fracture networks: 1. Synthetic data generation[J]. Water Resources Research, 2008, 44,W05404: 1-10. [24] 詹美礼, 速宝玉. 交叉裂隙水流N-S方程有限元分析[J]. 水科学进展, 1997(1):4-11. doi: 10.3321/j.issn:1001-6791.1997.01.001ZHAN Meili, SU Baoyu. Finite element analysis of N-S equation of intersection fissure flow[J]. Advances in Water Science, 1997(1): 4-11. doi: 10.3321/j.issn:1001-6791.1997.01.001 [25] 速宝玉, 詹美礼, 郭笑娥. 交叉裂隙水流的模型实验研究[J]. 水利学报, 1997(5):2-7.SU Baoyu, ZHAN Meili, GUO Xiaoe. Experiment research of cross fracture flow[J]. Journal of Hydraulic Engineering, 1997(5): 2-7. -


 点击查看大图
计量
- 文章访问数: 577
- HTML浏览量: 158
- PDF下载量: 117
- 被引次数: 0
