Change and its prediction of landscape patterns in the watershed of typical karst lake wetland
-
摘要: 岩溶湖泊湿地流域作为景观格局变化的热点研究区域,探讨景观格局动态变化及预测趋势,为岩溶流域生态安全研究提供科学依据。应用遥感与地理信息系统技术,结合普者黑岩溶湖泊湿地流域实际情况,分别对该地区1990、1995、2000、2005、2010、2015 年6 期遥感影像进行分类、解译,系统地获取地区景观格局状况,分析动态变化特征,并运用CA-Markov 模型对未来湿地景观格局进行模拟预测。结果表明:1990−2015年普者黑岩溶湿地流域景观格局随时间变化显著,景观破碎化程度总体呈现增加趋势,斑块数(NP)从861增加到889,景观类型的优势斑块面积在逐渐增加,而多样性指数从1.064下降到0.966;2020−2030年普者黑岩溶湿地流域建筑用地、农地和湿地景观类型面积在增加,农地和林地在减少,其中,较为突出的是建筑用地占有率由2.79%上升到2.97%,农地占有率60.12%增加到60.74%,湿地占有率6.67%上升7.02%,而林地占有率由26.70%下降到26.40%。景观格局进行预测可以发现湿地面积、建筑用地面积和农地变化幅度最大,本文相关研究和预测结果可为普者黑流域生态保护提供一定的建议和参考。
-
关键词:
- CA-Markov模型 /
- 岩溶湖泊湿地 /
- 景观格局 /
- 模拟与预测
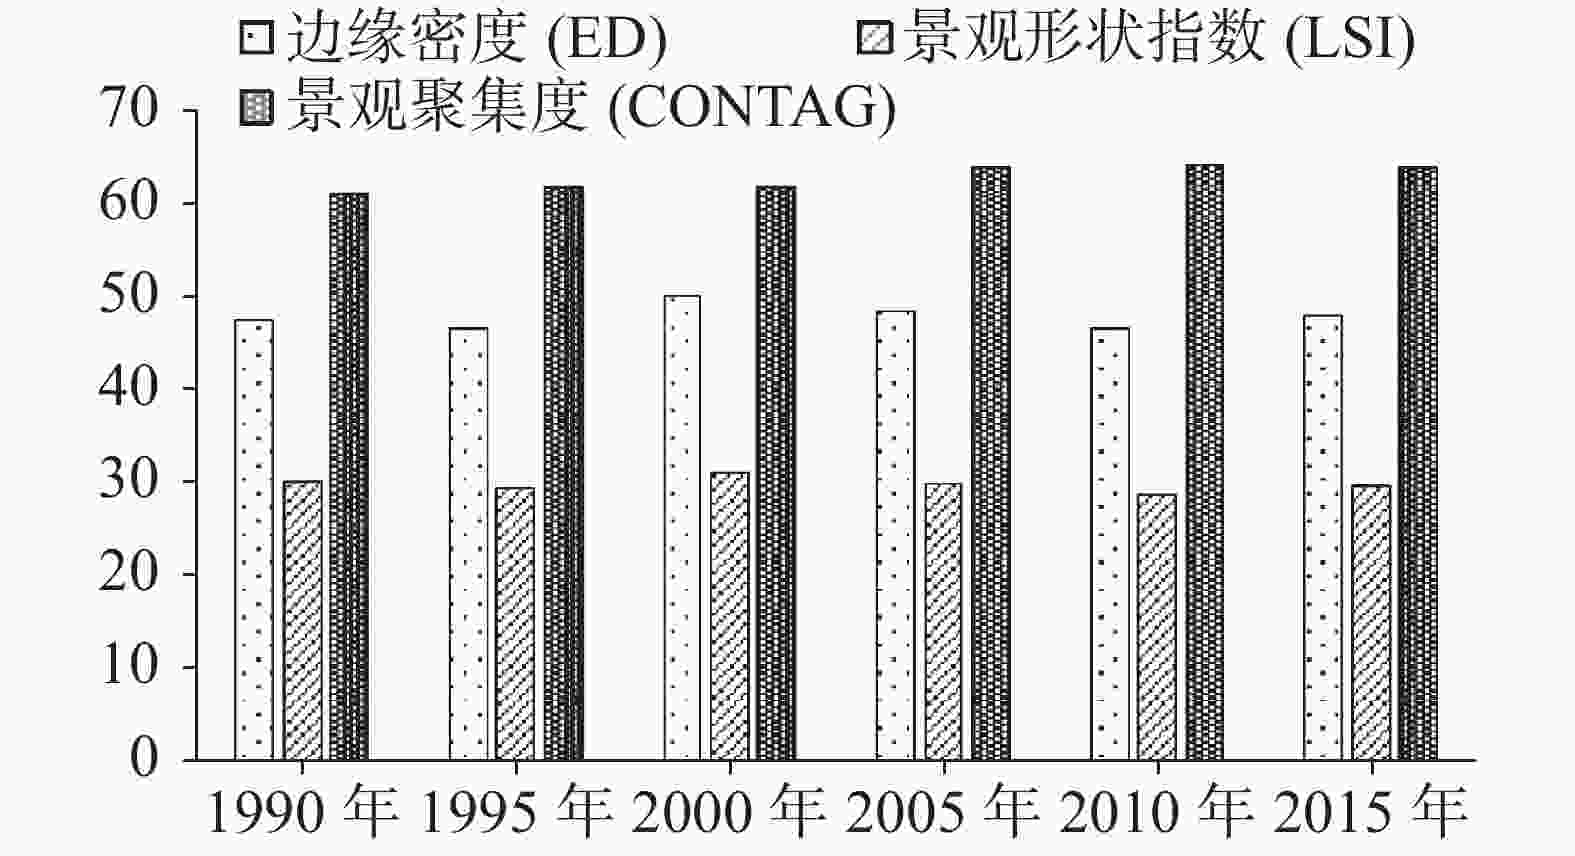
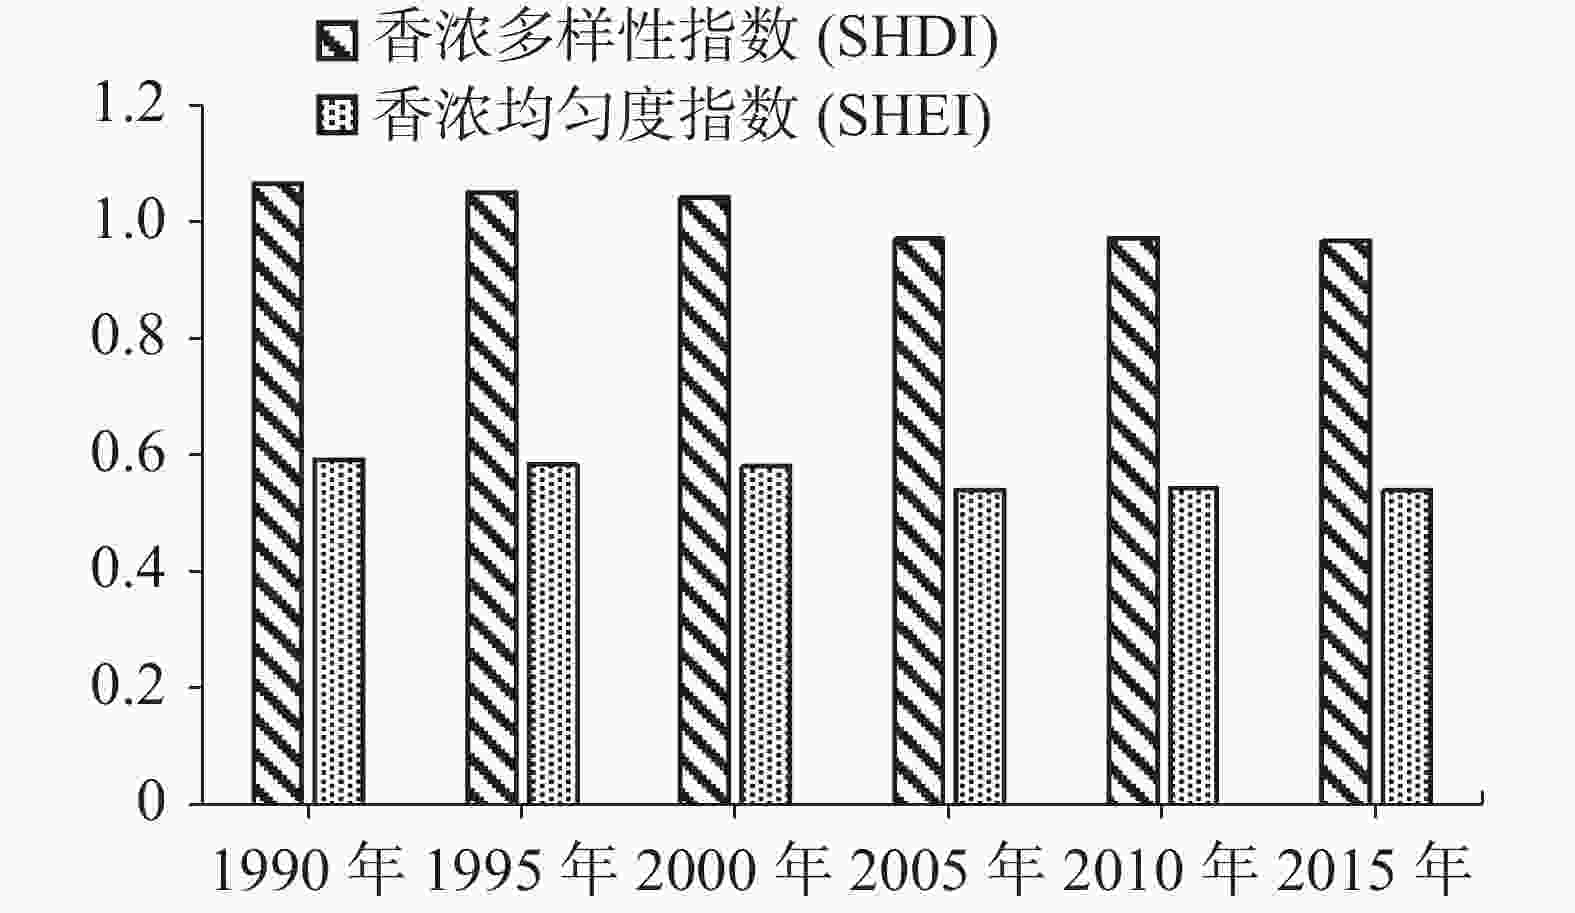
Abstract: As a research focus of landscape pattern change, the change and its prediction of landscape patterns in the watershed of karst lake is explored with the purpose of providing a scientific basis for the ecological safety in karst watershed in this study. The data of remote sensing image in the watershed of Puzhehei karst lake was collected in 1990, 1995, 2000, 2005, 2010, and 2015 respectively. With the remote sensing and geographic information system, those images were classified and interpreted based on the actual situation of this area. In addition, landscape patterns and the dynamic characteristics were analyzed and the pattern of future wetland landscape was simulated and predicted with CA-Markov model. Results show that landscape patterns of the watershed of Puzhehei karst wetland changed significantly from 1990 to 2015, during which construction land and agricultural land continued to increase, but woodland, wetland and unused land continued to decrease. The number of blocks (NP) rose from 861 to 889. Generally speaking, agricultural land is increasing year by year, but the growth rate is slow and the wetland landscape area is decreasing. Besides, from 1990 to 2015 the degree of landscape fragmentation in the Puzhehei watershed was generally augmented,and the number of landscape patches, patch density and number index of maximum patches also increased. The number of patches reached a maximum of 936, and the patch density index increased from 2.596 in 1990 to 2.822 in 2000, and then decreased to 2.689 in 2015. The number of maximum patches increased from 58.345 in 1990 to 62.036 in 2015, which means that the impact of human activities on the landscape pattern in the Puzhehei watershed made the landscape structure more complex and the fragmented. Finally, the dominant patch area of landscape types gradually increased from 1990 to 2015. The diversity index decreased from 1.064 to 0.966, and the edge density increased from 47.552 to 48.063. But the landscape shape index decreased from 30.175 to 29.625. Due to the continuous reduction of forest land and wetland in 2000, the landscape shape index increased and both the edge density and landscape shape index peaked at 49.987 and 31.012 respectively, which made the landscape structure complex. In the next 20 years, the landscape type change in Puzhehei watershed will generally show an increase in construction land, agricultural land and wetland, but a decrease in forest land, garden land and unused land. This trend can be reflected from the previous data: construction land increased from 2.79% to 2.97%, agricultural land from 60.12% to 60.74%, wetlands from 6.67% to 7.02%, but of forest land dropped from 26.70% to 26.40%. Accordingly, the land use pattern of Puzhehei watershed will change significantly. By 2030, the existing construction land will be expanded mainly around the scenic area of sinkholes as well as new in the villages and new towns around the National Wetland Park. Constrcution land will spread to the surrounding areas along with the main traffic roads. It is predicted that wetland, construction land and agricultural land will experience the largest change. The research findings can provide suggestions and reference for the ecological protection of the watershed Puzhehei karst lake.-
Key words:
- CA-Markov model /
- wetland of karst lake /
- landscape pattern /
- simulation and prediction
-
表 1 不同年份普者黑流域土地利用类型分类精度
Table 1. Classification precision of land use of Puzhehei basin in different year
时间(年) 1990 1995 2000 2005 2010 2015 影像类型 Landsat TM Landsat TM Landsat ETM Landsat TM Landsat TM Landsat OLI Kappa 系数 0.78 0.82 0.85 0.82 0.84 0.87 Kappa系数 一致性程度 < 0 很差 0~0.20 微弱 0.21~0.40 弱 0.41~0.60 适中 0.61~0.80 显著 0.81~1.00 最佳 表 3 普者黑岩溶湿地流域景观类型数量与面积变化(1990−2015)
Table 3. Change of number and area of the Puzhehei karst wetland landscape (1990-2015)
土地利用
类型1990年 1995年 2000年 2005年 2010年 2015年 斑块数 面积/ 斑块数 面积/ 斑块数 面积/ 斑块数 面积/ 斑块数 面积/ 斑块数 面积/ (NP) hm2 (NP) hm2 (NP) hm2 (NP) hm2 (NP) hm2 (NP) hm2 建设用地 59 549.05 58 621.82 60 674.26 62 706.77 65 756.37 63 784.77 林地 550 9 369.64 529 9 343.73 613 9 180.54 594 9 423.89 598 9 165.24 589 9 177.44 农地 107 19 670.03 103 19 818.32 102 20 045.42 95 20 695.63 89 20 777.79 84 20 804.27 湿地 91 2 319.14 89 2 241.09 110 2 190.14 63 1 573.34 60 1 848.94 62 1 916.19 未利用地 7 1024.34 6 898.55 5 838.81 7 530.71 6 376.1 10 243.12 园地 47 236.69 45 245.39 46 239.70 48 238.56 51 244.45 51 243.10 合计 861 33 168.90 830 33 168.90 936 33 168.90 869 33 168.90 869 33 168.90 859 33 168.90 表 4 普者黑岩溶湖泊湿地流域景观破碎化指数特征
Table 4. Fragmentation index of the Puzhehei karst wetland landscape
斑块数(NP)/个 斑块密度(PD) 最大斑块数(LPI)/个 1990年 861 2.596 58.345 1995年 830 2.502 58.911 2000年 936 2.822 59.404 2005年 869 2.62 61.797 2010年 879 2.62 61.218 2015年 889 2.69 62.036 表 5 2010年普者黑流域土地利用模拟与实际结果对比
Table 5. Comparison between simulation of land use and actual land use in the Puzhehei karst wetland in 2010
类型 预测面
积/hm2预测占
有率/%实际面
积/hm2实际占
有率/%模拟正
确率%建筑面积 650.80 1.96 554.81 1.67 85.25 农地 20 053.81 60.42 20 143.46 60.73 99.55 湿地 2 374.33 7.15 2 190.14 6.61 92.24 林地 8 908.94 26.84 9 180.61 27.68 97.04 园地 399.89 0.91 239.70 0.72 59.94 未利用地 1 001.26 2.72 860.18 2.59 85.91 合计 33 189.03 100 33 168.90 100 99.93 表 6 普者黑岩溶湖泊湿地流域2020年和2030年土地利用预测结果
Table 6. Prediction of land use of the Puzhehei karst wetland in 2020 and 2030
类型 2020年
面积/hm2预测占
有率/%2030年
面积/hm2预测占
有率/%建筑用地 928.99 2.79 980.07 2.97 农地 20 043.94 60.12 20 250.58 60.74 湿地 2 224.92 6.67 2 339.77 7.02 林地 8 901.94 26.70 8 801.94 26.40 园地 726.10 2.18 593.53 1.78 未利用地 511.37 1.53 371.37 1.11 合计 33 337.26 100 33 337.26 100 表 7 普者黑岩溶湖泊湿地流域2010年与2020年、2030年景观水平指数对比
Table 7. Comparison among the level index of the Puzhehei karst wetland landscape in 2010, 2020 and 2030
年份 景观指数 NP PD LPI ED LSI CONTAG SHDI SHEI 2010年 879 2.620 0 61.217 5 46.424 5 28.634 9 64.009 5 0.971 9 0.542 4 2020年 989 2.690 7 62.693 6 48.362 1 29.675 2 64.579 1 0.946 9 0.529 7 2030年 999 2.701 0 62.732 1 48.543 2 29.684 3 64.597 3 0.920 6 0.510 9 -
[1] 刘红玉, 李玉凤, 曹晓, 郝敬峰, 胡俊纳, 郑囡. 我国湿地景观研究现状、存在的问题与发展方向[J]. 地理学报, 2009, 64(11):1394-1401. doi: 10.3321/j.issn:0375-5444.2009.11.010LIU Hongyu, LI Yufeng, CAO Xiao, HAO Jingfeng, HU Junna, ZHEN Nan. The current problems and perspectives of landscape research of wetlands in China[J]. Acta Geographica Sinica, 2009, 64(11):1394-1401. doi: 10.3321/j.issn:0375-5444.2009.11.010 [2] 马祖陆, 蔡德所, 蒋忠诚. 岩溶湿地分类系统研究[J]. 广西师范大学学报(自然科学版), 2009, 27(2):101-106.MA Zulu, CAI Desuo, JIANG Zhongcheng. About karst wetland classification system[J]. Journal of Guangxi Normal University(Natural Science Edition, 2009, 27(2):101-106. [3] 宋涛, 于晓英, 邹胜章, 张连凯, 刘朋雨, 赵一, 沈利娜. 岩溶湿地退化评价指标体系构建初探[J]. 中国岩溶, 2020, 39(5):673-681.SONG Tao, YU Xiaoying, ZOU Shengzhang, ZHANG Liankai, LIU Pengyu, ZHAO Yi, SHEN Lina. Preliminary study on the construction of evaluation index system of karst wetland degradation[J]. Carsologica Sinica, 2020, 39(5):673-681. [4] 郎永娟, 种培芳, 林杨杰, 胡波, 宁建杨. 兰州秦王川国家湿地公园土地利用及湿地景观格局动态变化分析[J]. 园林, 2021, 38(7):58-66.LANG Yongjuan, ZHONG Peifang, LIN Yangjie, HU Bo, NING Jianyang. The analysis of dynamic changes of land use and wetland landscape pattern of Qinwangchuan national wetland park in Lanzhou, Gansu province[J]. Landscape Architecture, 2021, 38(7):58-66. [5] 郑青华, 罗格平, 朱磊, 周德成. 基于CA-Markov模型的伊犁河三角洲景观格局预测[J]. 应用生态学报, 2010, 21(4):873-882.ZHENG Qinghua, LUO Geping, ZHU Lei, ZHOU Decheng. Prediction of landscape patterns in Ili River Delta based on CA-Markov model[J]. Chinese Journal of Applied Ecology, 2010, 21(4):873-882. [6] Semlitsch R D. Critical elements for biologically based recovery plans of a quantic-breeding amphibian[J]. Conservation Biology, 2002, 16(3):619-629. doi: 10.1046/j.1523-1739.2002.00512.x [7] 李秀珍, 布仁仓, 常禹, 胡远满, 问青春, 王绪高, 徐崇刚, 李月辉, 贺红仕. 景观格局指标对不同景观格局的反应[J]. 生态学报, 2004, 24(1):123-134. doi: 10.3321/j.issn:1000-0933.2004.01.019LI Xiuzhen, BU Rencang, CHANG Yu, HU Yuanman, WEN Qingchun, WANG Xugao, XU Chonggang, LI Yuehui, HE Hongshi. The response of landscape metrics against pattern scenarios[J]. Acta Ecologica Sinica, 2004, 24(1):123-134. doi: 10.3321/j.issn:1000-0933.2004.01.019 [8] 肖羽芯, 王妍, 刘云根, 郭玉静, 张紫霞, 刘鹏. 典型岩溶湿地流域生态功能区划研究: 以滇东南普者黑流域为例[J]. 华中农业大学学报, 2020, 39(2):47-55.XIAO Yuxin, WANG Yan, LIU Yungen, GUO Yujing, ZHANG Zixia, LIU Peng. Research on ecological function regionalization of typical karst wetland watershed: take Puzhehei basin as an example[J]. Journal of Huazhong Agricultural University, 2020, 39(2):47-55. [9] 李益敏, 李卓卿. 国内外湿地研究进展与展望[J]. 云南地理环境研究, 2013, 25(1):37-40. doi: 10.3969/j.issn.1001-7852.2013.01.007LI Yimin, LI Zhuoqing. Progress and prospect of research on wetlands at home and abroad[J]. Yunnan Geographic Environment Research, 2013, 25(1):37-40. doi: 10.3969/j.issn.1001-7852.2013.01.007 [10] 白军红, 房静思, 黄来斌, 邓伟, 李爱农, 孔博. 白洋淀湖沼湿地系统景观格局演变及驱动力分析[J]. 地理研究, 2013, 32(9):1634-1644. doi: 10.11821/dlyj201309006BAI Junhong, FANG Jingsi, HUANG Laibin, DENG Wei, LI Ainong, KONG Bo. Landscape pattern evolution and its driving factors of Baiyangdian lake-marsh wetland system[J]. Geographical Research, 2013, 32(9):1634-1644. doi: 10.11821/dlyj201309006 [11] 陈静, 罗明明, 廖春来, 马瑞, 周宏, 邹胜章, 陈植华. 中国岩溶湿地生态水文过程研究进展[J]. 地质科技情报, 2019, 38(6):221-230.CHEN Jing, LUO Mingming, LIAO Chunlai, MA Rui, ZHOU Hong, ZOU Shengzhang, CHEN Zhihua. Review of eco-hydrological process in karst wetlands of China[J]. Geological Science and Technology Information, 2019, 38(6):221-230. [12] 李军, 邹胜章, 梁永平, 林永生, 周长松, 赵一. 会仙岩溶湿地水体金属元素分布与健康风险评价[J]. 环境科学, 2020, 41(11):4948-4957.LI Jun, ZOU Shengzhang, LIANG Yongping, LIN Yongsheng, ZHOU Changsong, ZHAO Yi. Metal distributions and human health risk assessments on waters in the Huixian karst wetland, China[J]. Environmental Science, 2020, 41(11):4948-4957. [13] 朱丹尼, 邹胜章, 周长松, 赵一, 卢海平, 谢浩. 桂林会仙岩溶湿地水位动态特征及水文生态效应[J]. 中国岩溶, 2021, 40(4):661-670.ZHU Danni, ZOU Shengzhang, ZHOU Changsong, ZHAO Yi, LU Haiping, XIE Hao. Dynamic characteristics of water Level and hydro-ecological effects in Huixian karst wetland in Guilin[J]. Carsologica Sinica, 2021, 40(4):661-670. [14] 李丽, 刘普幸, 姚玉龙. 近28年金昌市土地利用动态变化及模拟预测[J]. 生态学杂志, 2015, 34(4):1097-1104.LI Li, LIU Puxing, YAO Yulong. Land-use dynamic change of Jinchang City in the last 28 years and simulation prediction[J]. Chinese Journal of Ecology, 2015, 34(4):1097-1104. [15] 凌成星, 鞠洪波, 张怀清, 孙华. 基于CA-Markov模型的北京湿地资源变化预测研究[J]. 中国农学通报, 2012, 28(20):262-267. doi: 10.11924/j.issn.1000-6850.2011-3361LING Chengxing, JU Hongbo, ZHANG Huaiqing, SUN Hua. Study on the forecast of wetland resources changes in Beijing based on CA-Markov model[J]. Chinese Agricultural Science Bulletin, 2012, 28(20):262-267. doi: 10.11924/j.issn.1000-6850.2011-3361 [16] 侯西勇, 常斌, 于新芳. 基于CA-Markov的河西走廊土地利用变化研究[J]. 农业工程学报, 2004, 20(5):286-291. doi: 10.3321/j.issn:1002-6819.2004.05.065HOU Xiyong, CHANG Bin, YU Xinfang. Land use change in Hexi corridor based on CA-Markov methods[J]. Transactions of the Chinese Society of Agricultural Engineering, 2004, 20(5):286-291. doi: 10.3321/j.issn:1002-6819.2004.05.065 [17] 张海龙, 蒋建军, 解修平, 吴宏安, 张丽. 基于GIS与马尔可夫模型的渭河盆地景观动态变化研究[J]. 干旱区资源与环境, 2005, 19(7):119-124. doi: 10.3969/j.issn.1003-7578.2005.z1.025ZHANG Hailong, JIANG Jianjun, XIE Xiuping, WU Hongan, ZHANG Li. Analysis on landscape dynamics of Weihe basin based on gis and markov methods[J]. Journal of Arid Land Resources and Environment, 2005, 19(7):119-124. doi: 10.3969/j.issn.1003-7578.2005.z1.025 [18] 陈爱玲, 都金康. 基于CA-Markov模型的秦淮河流域土覆盖格局模拟预测[J]. 国土资源遥感, 2014, 26(2):184-188.CHEN Ailing, DU Jinkang. Simulation and forecast of land cover pattern in Qinhuai river basin based on the CA-Markov model[J]. Remote Sensing for Land & Resource, 2014, 26(2):184-188. [19] 张小松. 西宁市土地利用景观格局演变及预测研究[D]. 北京: 中国地质大学(北京), 2014.ZHANG Xiaosong, Dynamics and prediction of landscape in land utilization of Xining city[D]. Beijing:China University of Geosciences(Beijing), 2014. [20] 闫文文. 基于3S和CA的盐城滨海湿地景观格局演变及预测模拟研究[D]. 青岛: 国家海洋局第一海洋研究所, 2012.YAN Wenwen. Study of landscape changing on Yancheng coastal wetlands based on gis and ca technology[D].Qingdao: First Institute of Oceanography, MNR, 2012. [21] 赵永华, 贾夏, 刘建朝, 刘耿. 基于多源遥感数据的景观格局及预测研究[J]. 生态学报, 2013, 33(8):2556-2564.ZHAO Yonghua, JIA Xia, LIU Jianchao, LIU Geng. Analysis and forecast of landscape pattern in Xi'an from 2000 to 2011[J]. Acta Ecologica Sinica, 2013, 33(8):2556-2564. [22] 谭志卫. 3S技术支持下的抚仙湖流域景观格局变化研究[J]. 环境科学导刊, 2015, 34(5):117-121. doi: 10.3969/j.issn.1673-9655.2015.05.032TAN Zhiwei. Dynamic changes of landscape pattern in the Fuxianhu lake basin based on 3S technology[J]. Environmental Science Survey, 2015, 34(5):117-121. doi: 10.3969/j.issn.1673-9655.2015.05.032 [23] 郭玉静, 王妍, 刘云根, 郑毅, 张超, 侯磊. 普者黑岩溶湖泊湿地湖滨带景观格局演变对水质的影响[J]. 生态学报, 2018, 38(5):1711-1721.GUO Yujing, WANG Yan, LIU Yungen, ZHENG Yi, ZHANG Chao, HOU Lei. The effects of landscape pattern evolution in Puzhehei karst lake wetland littoral zone on water quality[J]. Acta Ecologica Sinica, 2018, 38(5):1711-1721. [24] 毛转梅, 刘青, 彭尔瑞, 陈劲松, 吴培军. 云南普者黑湿地流域水域面积变化及其影响因素[J]. 江西农业学报, 2021, 33(5):109-114. doi: 10.19386/j.cnki.jxnyxb.2021.05.017MAO Zhuanmei, LIU Qing, PENG Errui, CHEN Jinsong, WU Peijun. Dynamic changes of water area in yunnan Puzhehei wetland river basin and its influencing factors[J]. Acta Agriculturae Jiangxi, 2021, 33(5):109-114. doi: 10.19386/j.cnki.jxnyxb.2021.05.017 -


 下载:
下载:


